Pharmaceutical Sciences. 32(2):243-250.
doi: 10.34172/PS.026.42693
Original Article
A Laser Monitoring Technique for Investigating the Solubility and Thermodynamic Properties of Ivermectin in Aqueous Mixtures of Ethylene Glycol
Soma Khezri Data curation, Investigation, 1 
Reza Ghotaslou Funding acquisition, Resources, Visualization, Writing – review & editing, 2
Kader Poturcu Data curation, Investigation, 3
Vahid Jouyban-Gharamaleki Software, Validation, 4, 5
Elaheh Rahimpour Conceptualization, Methodology, Project administration, Supervision, Writing – original draft, 1, *
Abolghasem Jouyban Conceptualization, Supervision, Writing – review & editing, 1
Author information:
1Pharmaceutical Analysis Research Center and Faculty of Pharmacy, Tabriz University of Medical Sciences, Tabriz, Iran
2Infectious and Tropical Diseases Research Center, Tabriz University of Medical Sciences, Tabriz, Iran
3Department of Chemistry, Faculty of Engineering and Natural Science, Suleyman Demirel University, Isparta, Türkiye
4Liver and Gastrointestinal Diseases Research Center, Tabriz University of Medical Sciences, Tabriz, Iran
5Kimia Idea Pardaz Azarbayjan (KIPA) Science Based Company, Tabriz University of Medical Sciences, Tabriz, Iran
Abstract
Background:
Ivermectin (IVM) is a broad-spectrum antiparasitic drug used in humans and animals to treat infections like scabies, river blindness, and various worms. Derived from avermectin via fermentation, IVM contains impurities and degradation products. During pandemics like COVID-19, demand for IVM formulations surges, requiring specialized manufacturing. Classified as a Biopharmaceutics Class II drug, IVM has high permeability but low solubility, leading to poor dissolution and variable absorption, impacting efficacy. Enhancing solubility can improve bioavailability and aid in purification, crystallization, and analysis. Thus, optimizing IVM formulations is crucial for better therapeutic outcomes.
Methods:
This work investigated the IVM solubility in binary mixtures of ethylene glycol and water, at a temperature range of 298.2 K to 313.2 K. A laser-based robotic system was employed to measure the solubility data. The generated solubility values were presented utilizing various thermodynamic models, such as the van’t Hoff, mixture response surface, Jouyban-Acree, Jouyban-Acree-van’t Hoff, and modified Wilson models. Several thermodynamic factors, including ΔG°, ΔH°, and ΔS° were also computed according to the experimental findings.
Results:
The results showed that in the EG -rich mixtures and proportional to temperature, the IVM solubility significantly increased. The mathematical models effectively estimated IVM solubility in binary solvents, with MRD% ranging from 5.7 to 13.7. Thermodynamic analysis revealed non-spontaneous dissolution, and endothermic reaction for IVM dissolution in the investigated mixtures.
Conclusion:
These properties offered valuable insights into the energetic characteristics of the dissolution process and computed utilizing the Gibbs and van’t Hoff equations.
Keywords: Ivermectin, Laser monitoring technique, Mathematical modeling, Thermodynamic parameters
Copyright and License Information
© 2026 The Author(s).
This is an open access article and applies the Creative Commons Attribution Non-Commercial License (
http://creativecommons.org/licenses/by-nc/4.0/). Non-commercial uses of the work are permitted, provided the original work is properly cited.
Funding Statement
Research reported in this publication was supported by Elite Researcher Grant Committee under grant number 4003663 from the National Institutes for Medical Research Development (NIMAD), Tehran, Iran.
Introduction
Ivermectin (IVM) possesses a wide-ranging antiparasitic effect against various internal and external nematodes and arthropods.1 It has been- utilized generally in humans, cattle, and other animals. This medication is commonly employed to address parasitic infections such as head lice, scabies, rashes, river blindness, lymphatic filariasis, and several types of worms, including gastrointestinal roundworms, lungworms, heartworms, pinworms, and whipworms.2 IVM is a semi-synthetic medication, derived from avermectin via a fermentation process. Avermectin is the initial material used to produce bulk IVM. During fermentation, numerous isomers are generated, which are incorporated into the bulk IVM drug substance. Consequently, typical bulk batches of IVM contain significant amounts of process-related impurities and degradation products.3 It should be noted that during pandemic situations such as the COVID-19 outbreak, there may be a significant demand for IVM pharmaceutical formulations on a large scale. So, preparing and purifying these bulk solid oral dosage forms, including tablets and capsules, requires specialized manufacturing infrastructure and considerable resources. Additionally, IVM is classified as a class II drug under the Biopharmaceutics Classification System, characterized by high permeability but poor water solubility (0.005 mg/mL). Due to these characteristics, the drug dissolves poorly, resulting in inconsistent absorption that may reduce its bioavailability and therapeutic effectiveness.4 Improving drug solubility enhances oral bioavailability and is also beneficial for purification, crystallization, separation, and analytical processes.5 Different methods have been developed to solve the problem of poor solubility. The methods involve cosolvency, solid dispersion, particle size minimization, crystal engineering, salt formation, surfactant addition, complexation, pH tuning, nanosuspension, chemical modification, and hydrotropy.6 Cosolvency represents a frequently utilized strategy among these solubility-enhancing techniques.7 Cosolvency studies contribute valuable knowledge about mixed solvent-solute interactions, opening doors for multidisciplinary applications.
So far, limited data have been published for the IVM solubility, which includes some monosolvents such as water, N-methyl-2-pyrrolidone, 2-pyrrolidone, triacetin, and benzyl benzoate,8 as well as various oils including cod liver oil, castor oil, isopropyl myristate, triacetin, rose oil, isopropyl palmitate, soybean oil, olive oil, almond oil, coconut oil, in addition to surfactants like Tween 20, 60, and 80, and co-surfactants such as Span 20, 80, and polyethylene glycol 400.9 The binary systems reported for IVM were ethanol/methanol + water mixtures published by Xu et al10 and 1-propanol/2-propanol + water mixtures by Khezri et al.11 However, detailed information about its solubility in additional binary solvent mixtures is still limited.
Herein, an automated laser-based technique was utilized to measure IVM solubility. The experimental procedure involves employing a mechanical arm to add the drug powder to the solubility vessel while monitoring the particles within the vessel using a laser beam. To date, our team has applied this system to explore and report the solubility of different drugs in binary mixtures. The objectives of the current work were to (1) measure the IVM solubility in aqueous mixtures of ethylene glycol (EG); (2) fit the data to several mathematical models; and (3) analyze the thermodynamic properties of IVM dissolution in the studied mixtures.
Materials and Methods
Materials
Herein, IVM served as the solute, while EG and distilled water were used to prepare the solvent mixtures. Table 1 summarizes their chemical structures, purity levels, and sources.
Table 1.
Details of the chemical structure and purity of the used materialsa
|
Material
|
Molecular formula
|
Molar mass (g mol-1) |
Molecular structure
|
Mass fraction purity
|
Source
|
| IVM |
C48H74O14 |
875.106 |
|
> 0.999 |
Bekir Karliga Deva Holding (Turkey) |
| EG |
C2H6O2 |
62.068 |
|
0.998 |
Sigma Aldrich (USA) |
| Water |
H2O |
18.02 |
|
Distilled deionized water |
Lab made |
a The purity of the employed chemicals was provided by the suppliers.
X-ray powder diffraction (XRD) and differential scanning calorimeter (DSC) analysis
Crystallinity analysis of IVM in various states (raw, residual powder after equilibrated in neat EG/water) was carried out via XRD (Philips PW1730). The diffraction patterns were recorded from 10° to 40° 2θ using 30 mA current and 40 kV voltage under normal atmospheric conditions. For the analysis, initially an excess of the drug powder was added to the solvents being examined, allowing them to reach equilibrium under experimental conditions. After equilibrium is established, the supernatant solution was separated and the residual solid in the container was dried for analysis. It is noteworthy that, due to the high boiling point of the non-volatile solvent EG, the residual solid was washed several times with ethanol, and eventually, XRD is performed on the final dried product, as described in a previously published article.12
A TA Instruments SDT 650 Simultaneous DSC/TGA (New Castle, USA) was also utilized to study the melting point of raw IVM and residual powder after equilibrated in neat EG/water. The DSC conditions were: scanning rate of 10.0°C/min under O2 (252.5 mL/min) and N2 (250.0 mL/min) gaseous.
Solubility determination
The solubility of IVM in EG and water mixtures was determined using a laboratory-designed setup at temperatures ranging from 298.2 to 313.2 K under ambient pressure conditions (≈85 kPa). The operational principles of this apparatus have been explained completely in our earlier publication.13 In this approach, saturation is achieved by progressively introducing solid drug material into an initially unsaturated solvent mixture. The instrument uses laser monitoring to track changes in the drug particles as they dissolve in the solution. The solubility data were obtained by quantifying the drug mass added to the dissolution medium using gravimetric analysis. In the robotic setup, the entire processing time is reduced to just 10 to 15 minutes, which includes preparing the solvent and weighing the powder at both the beginning and end of the test. A laser beam with a wavelength between 650 and 750 nm is utilized to detect changes in the drug particles. The volumes of solvent used in this technique range from a minimum of 100 mL to a maximum of 320 mL. The mixing occurs in a closed environment to minimize evaporation and facilitate the solubility assessment in various solvents, whether binary, multiple, aquatic, or non-aquatic. For conducting an experiment with this system, the process starts with adjusting the temperature before the solute powder is added to the dissolution vessel using a robotic arm, which can accommodate either mono- or mixed solvents. During laser monitoring, a magnetic stirrer homogenizes the solution in the dissolution vessel. An automated robot incrementally introduces solute powder until the initially undersaturated solution achieves saturation, signaled by a green indicator light. The system verifies the saturation point at programmed intervals. To calculate solubility, the dispensed powder mass is gravimetrically determined post-addition.14
Mole fraction solubility for IVM was obtained using equation (1).
where m1 and m2 are the mass (g) of the dispended solute and solvent, respectively and M1 and M2 are the molar mass (g.mol–1) of solute and solvent, respectively. The reported values were the mean of three replicated measurements.
Mathematical computations
Herein, some well-known models were used to investigate the correlation between solubility data, temperature, and solvent compositions. The equations checked include the van’t Hoff, Jouyban-Acree, Jouyban-Acree-van’t Hoff, mixture response surface (MRS), and modified Wilson models. The van’t Hoff equation (Equation 215) demonstrates the relationship between temperature and solute dissolution in solvent mixtures. The MRS model (Equation 316) establishes the relationship between solvent composition and drug solubility at a specified temperature. The Jouyban-Acree model (Equation 4) and the Jouyban-Acree-van’t Hoff model (Equation 517) establish quantitative solubility relationships incorporating both compositional and thermal variables. Finally, the modified Wilson model (Equation 618), as a non-linear equation, establishes the composition-solubility relationship at a specified temperature.
(3)
(4)
(5)
(6)
In which, the solubilities of the solute in the solvent mixtures and mono-solvents 1 and 2 are represented by xm, x1 and x2, respectively, while the mass fractions of solvent 1 and solvent 2 are w1 and w2. Other parameters A, B, Ji, β i, λij are model parameters and were obtained from linear and non-linear regressions. The mean relative deviation (MRD %) (Equation 7) is used to express the model accuracy.
(7)
The N is the data point number.
Computation of appearance thermodynamic parameters
Thermodynamic analysis was performed using the van’t Hoff equation to determine key parameters, including the standard dissolution enthalpy (ΔH°), Gibbs free energy change (ΔG°), and standard dissolution entropy (ΔS°) of IVM in EG-water mixtures.19 The van’t Hoff equation was employed to calculate the ΔH° in these solvent mixtures, as follows:
Here, R is the ideal gas constant and Thm represents the mean harmonic temperature acquired by
, where n is the number of the tested temperatures. Herein, Thm value is 305.6 K. The ΔH° value is obtained by plotting lnx against (1/T - 1/Thm) (Equation 8). The plot slope is utilized to compute ΔH°. We assume constant solution heat capacity change between 298.2 and 313.2 K. The ΔG° and ΔH° values are also, computed from the intercept and slope of the plot in Equation 8, respectively. The Gibbs equation is then used to compute ΔS° using ΔH° and ΔG° (Equation 9):
As both enthalpy and entropy have key roles in the dissolution process, their contributions (ζTS and ζH) can be obtained using Equations 10 and 11:
Results and Discussion
XRD and DSC analysis
Figure 1 showed the XRD data for IVM residues in the investigated solvents of EG and water. This analysis aimed to identify whether solid IVM in saturated solutions produced solvated or polymorphic compounds. The results indicated that no new characteristic peaks appeared, implying that the crystallinity of IVM (as reported in reference20) remained stable and did not experience polymorphic transformation during dissolution in the solvents examined.
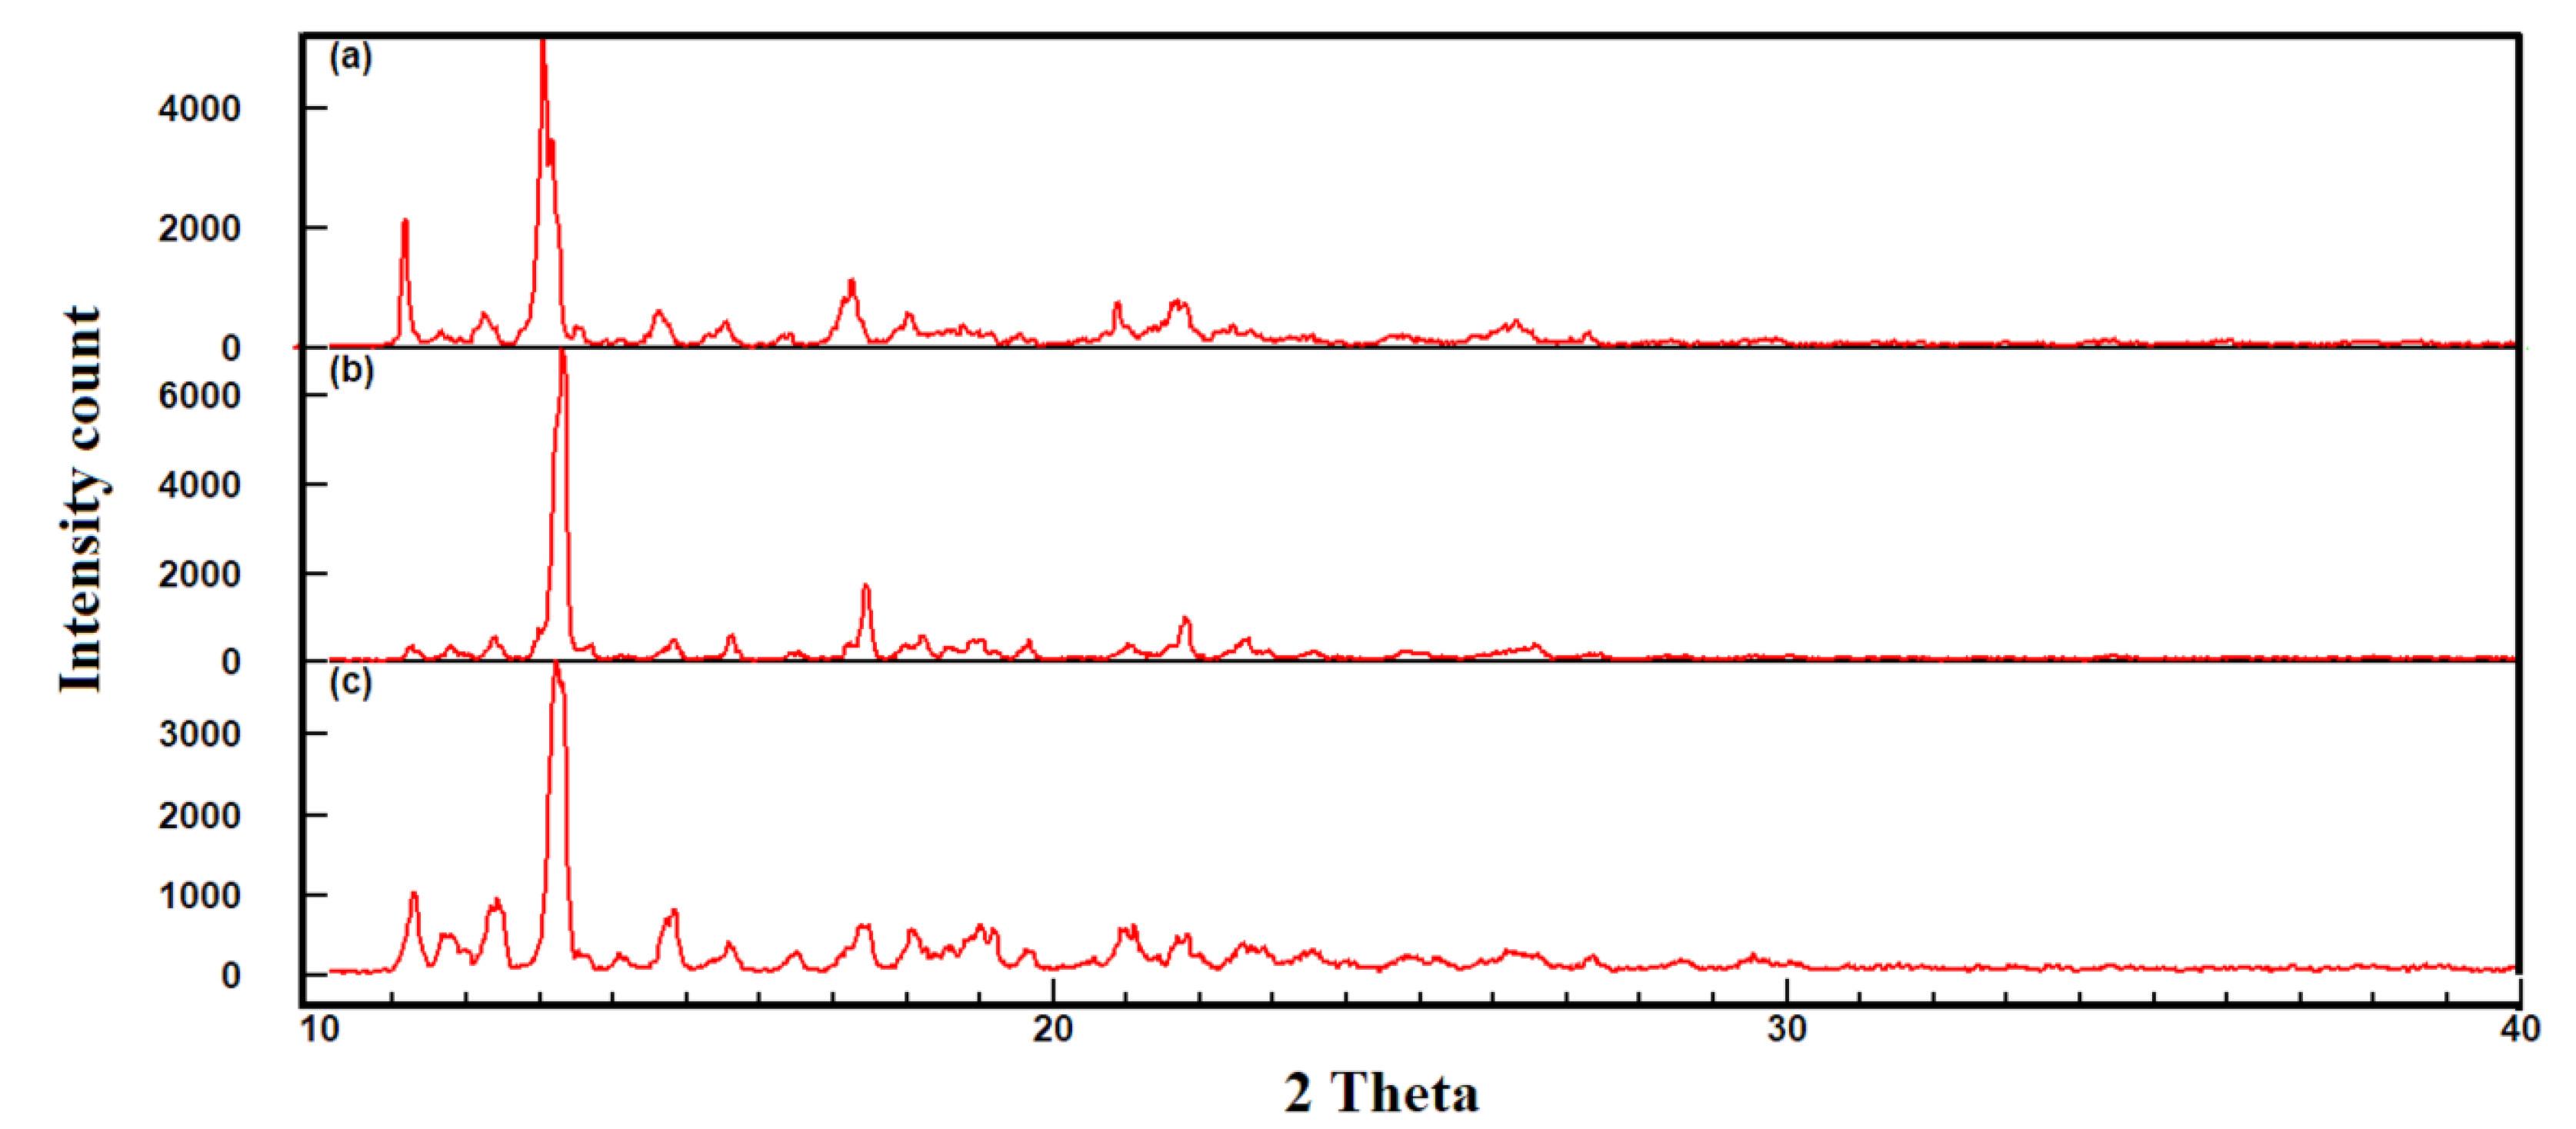
Figure 1.
XRD pattern of raw IVM (a) and equilibrated IVM in EG (b), and water (c)
.
XRD pattern of raw IVM (a) and equilibrated IVM in EG (b), and water (c)
DSC analysis was used to determine the melting points of both raw and equilibrated IVM in the used solvents. As can be seen in Figure 2, the melting point of raw IVM (153.8 ± 0.5 °C,4), derived from the peak temperature in the DSC curves, was similar for both forms (i.e., residual in EG with melting point 155.3 ± 0.5 °C and residual in water with melting point 154.3 ± 0.5 °C), indicating that the crystallinity of raw IVM remained unchanged after dissolution procedure in the studied solvents.
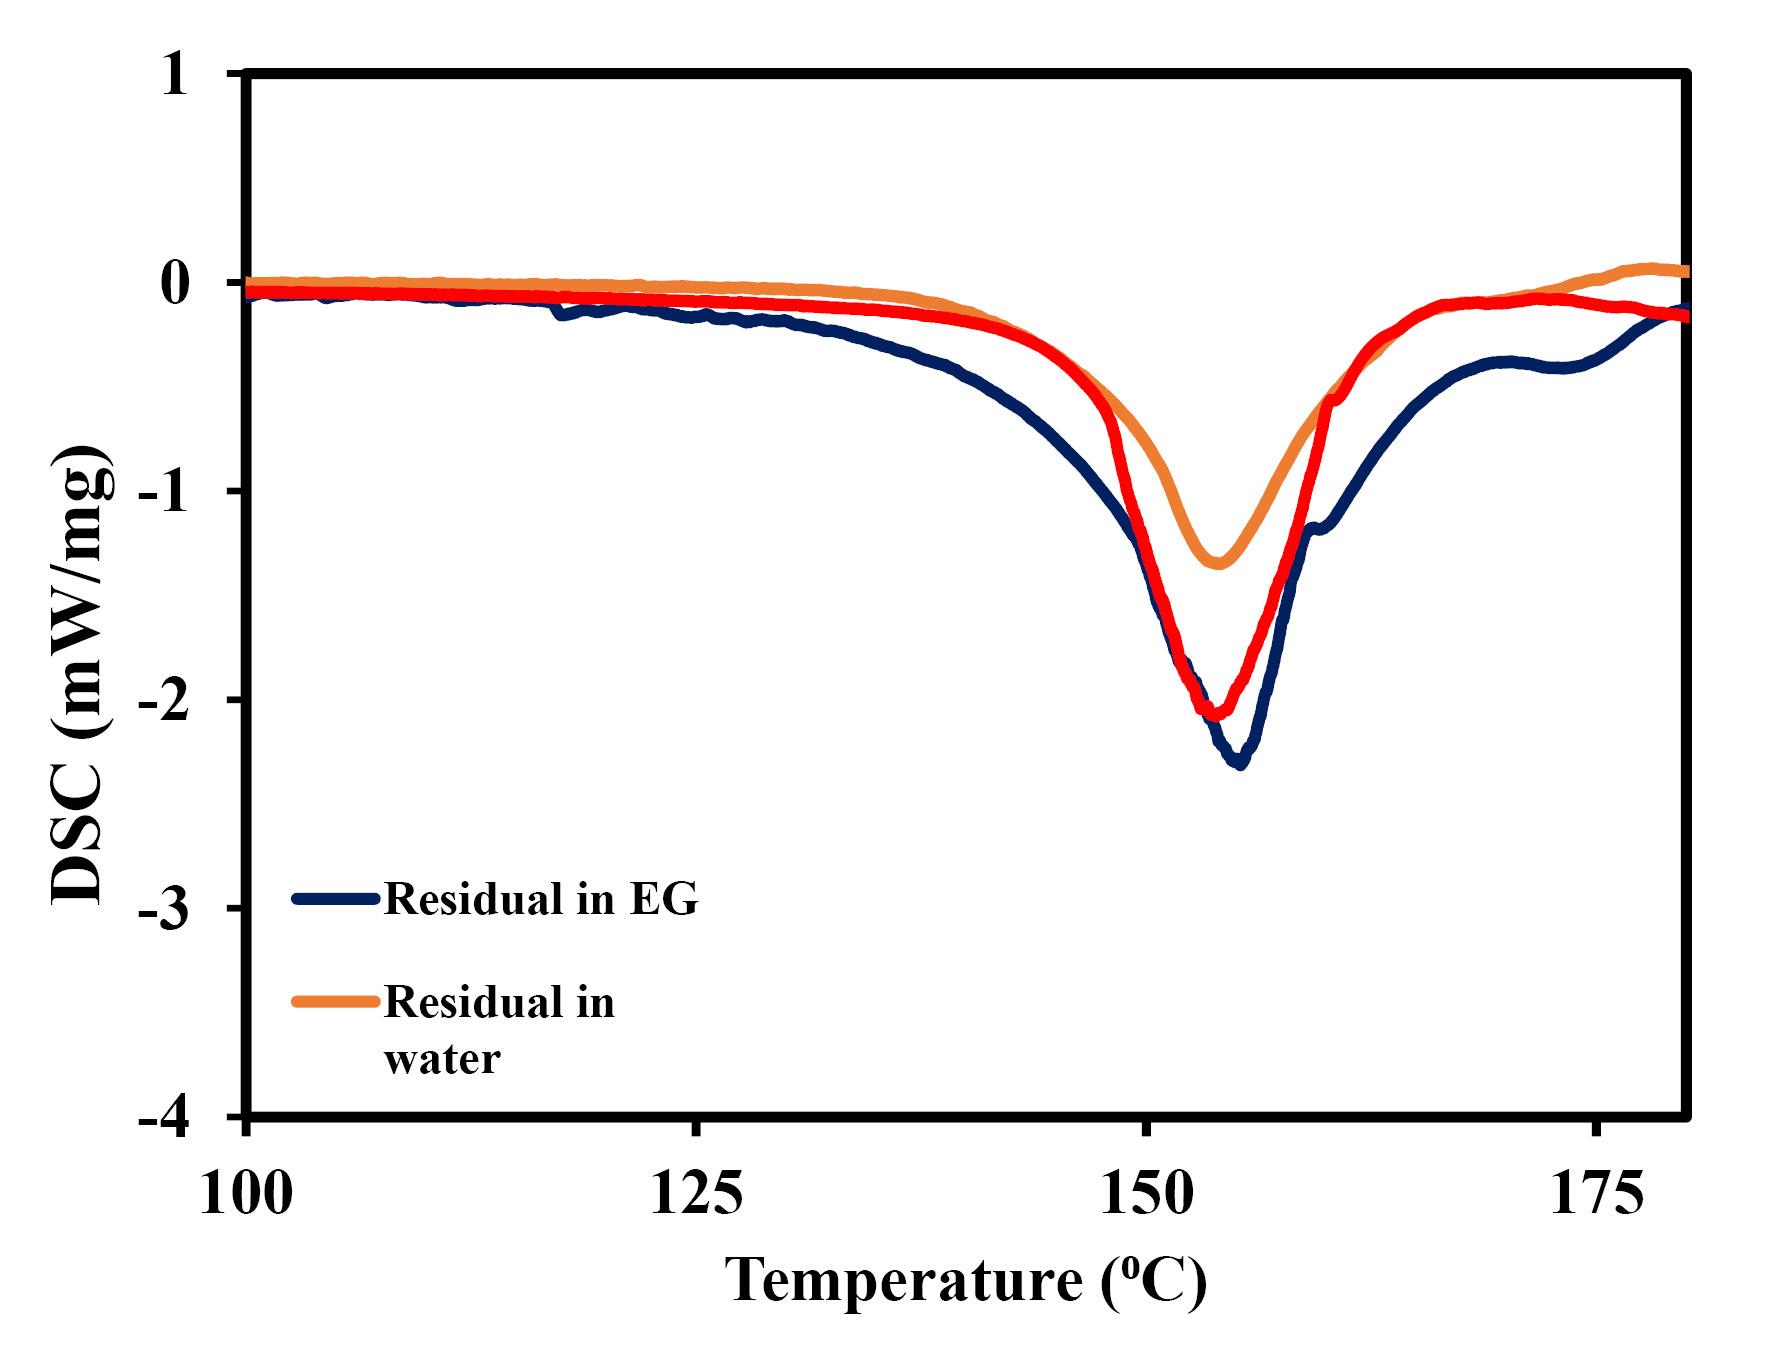
Figure 2.
DSC curves of IVM in raw and equilibrated forms
.
DSC curves of IVM in raw and equilibrated forms
Solubility profile of ivermectin
IVM’s solubility in mixtures of EG + water can be understood through the analysis of the data presented in Table 2. The Table displayed temperature-dependent solubility measurements (expressed as mole fractions) at different EG compositions, with associated standard deviations. ideal solubility calculations for the 298.2-313.2 K range are also included. The ideal solubility was calculated using literature-reported values of IVM’s melting temperature (TM) and enthalpy of fusion (ΔHf). (TM = 430.15 K21, ΔHf = 61 KJ/mol). For better visual comprehension, the solubility profile of IVM was also plotted in Figure 3. In this solubility system, the lowest solubility of IVM was obtained in neat water at 298.2 K (xm = 4.97 × 10⁻⁶) and the highest solubility was reported when the mixtures contained the highest concentrations of EG (w1 = 1.0, neat EG). Moreover, the solubility of IVM increased with rising temperature. Considering that IVM with log P = 5.839, dipole moment: 4.14 D22 and Hansen solubility parameters of δD = 18.0, δP = 12.80, δH = 10.01 (Hansen solubility parameters were obtained from Hoy software23), EG with log P = -1.69, dipole moment: 2.27 D, dielectric constant of 37.0 and Hansen solubility parameters of δD = 17.0, δP = 11.0, δH = 26.0, and water with dipole moment: 1.85 D,24 a dielectric constant of 78.425 and Hansen solubility parameters of δD = 15.50, δP = 16.00, δH = 42.30, the solubility of IVM in EG was expected to be higher than in water owing to the similarity in their molecular structures, as indicated by their Hansen solubility parameters.
Table 2.
Experimental mole fraction solubility (xm,T) values ( ± SD) for IVM in EG + water mixtures at different temperatures and ambient pressure (≈ 85 kPa)
|
w1a
|
298.2 K
|
303.2 K
|
308.2 K
|
313.2 K
|
| 0.00 |
4.97 ( ± 0.09) × 10–6 |
9.94 ( ± 0.11) × 10–6 |
1.37 ( ± 0.08) × 10–5 |
1.71 ( ± 0.14) × 10–5 |
| 0.10 |
7.56( ± 0.10) × 10–6 |
1.57 ( ± 0.12) × 10–5 |
2.10 ( ± 0.11) × 10–5 |
2.77 ( ± 0.09) × 10–5 |
| 0.30 |
8.49 ( ± 0.08) × 10–6 |
1.61 ( ± 0.09) × 10–5 |
2.28 ( ± 0.10) × 10–5 |
2.81 ( ± 0.11) × 10–5 |
| 0.50 |
1.67 ( ± 0.09) × 10–5 |
2.31 ( ± 0.09) × 10–5 |
3.34 ( ± 0.12) × 10–5 |
4.28 ( ± 0.09) × 10–5 |
| 0.70 |
2.39 ( ± 0.11) × 10–5 |
3.13 ( ± 0.09) × 10–5 |
4.62 ( ± 0.10) × 10–5 |
5.59 ( ± 0.08) × 10–5 |
| 0.90 |
8.40 ( ± 0.13) × 10–5 |
9.52 ( ± 0.11) × 10–5 |
1.15 ( ± 0.09) × 10–4 |
1.19 ( ± 0.11) × 10–4 |
| 1.00 |
2.67 ( ± 0.10) × 10–4 |
2.86 ( ± 0.08) × 10–4 |
2.99 ( ± 0.11) × 10–4 |
3.14 ( ± 0.11) × 10–4 |
| Ideal x |
5.28 × 10⁻⁴ |
7.92 × 10⁻⁴ |
1.17 × 10⁻³ |
1.71 × 10⁻³ |
aw1 is the mass fraction of EG in EG and water mixtures in the absence of ivermectin.
Standard uncertainty u is u(T) = ± 0.1K; u(p) = ± 0.05 bar. Also, relative standard uncertainties are obtained below 5% for mole fractions and solubilities. The value of the coverage factor k = 2 was chosen based on the level of confidence of approximately 95%.
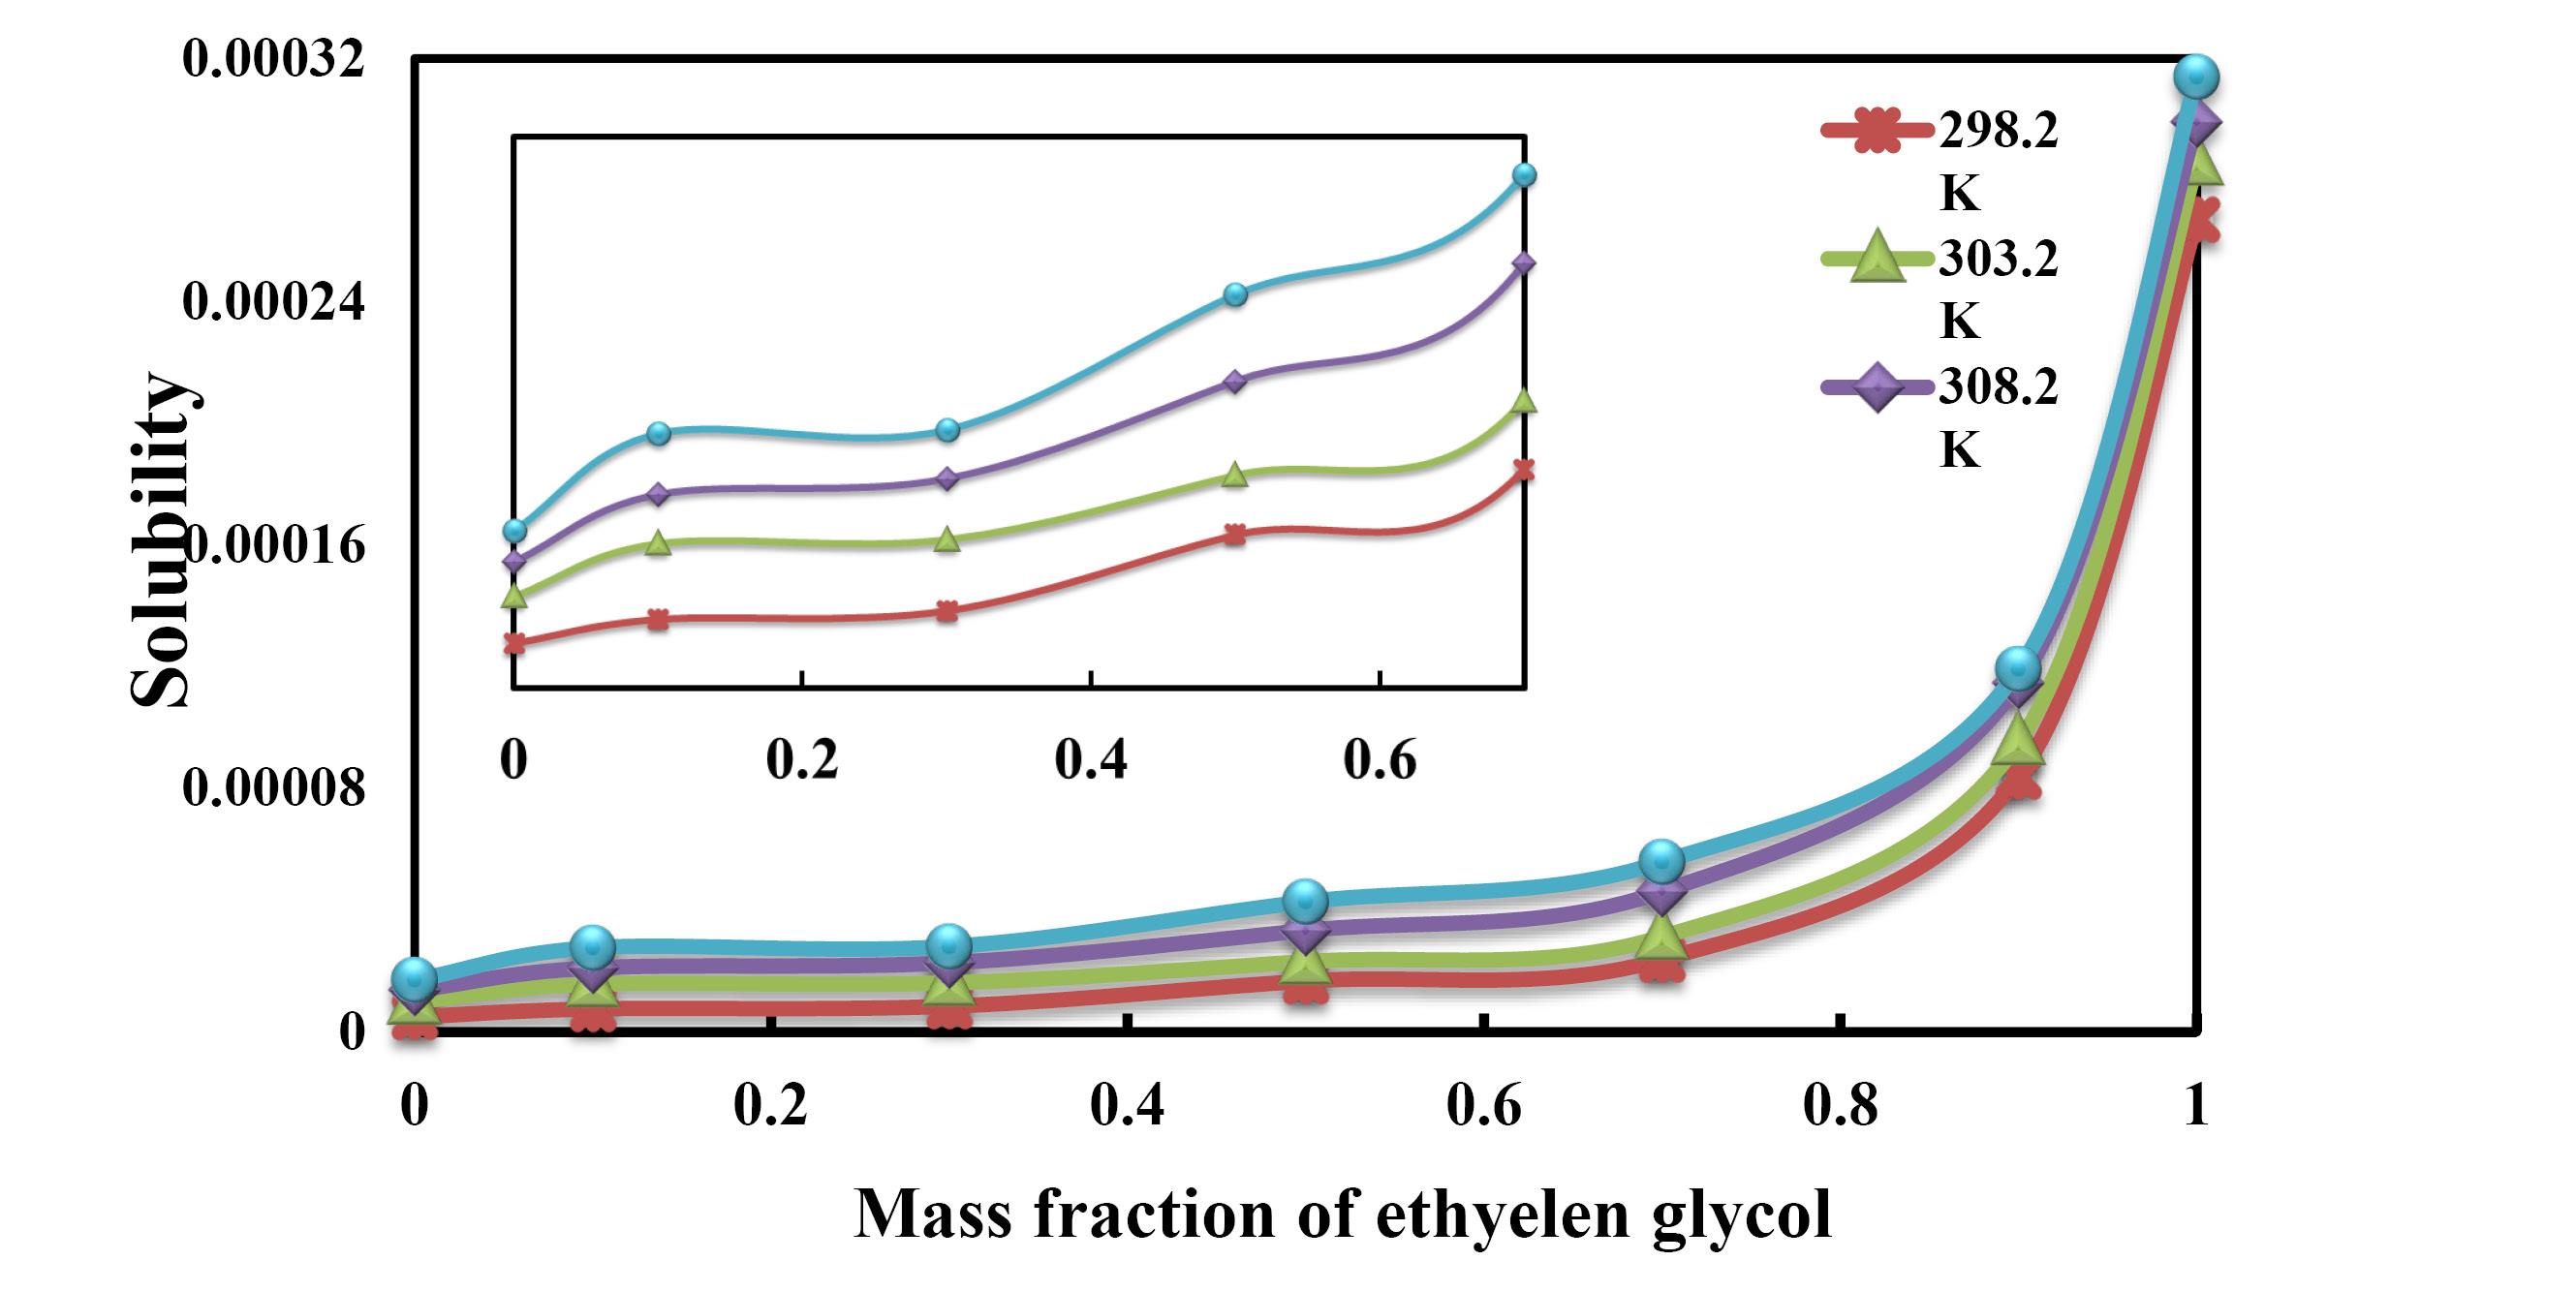
Figure 3.
Solubility profile of for IVM in EG + water mixtures at 298.2-313.2 K
.
Solubility profile of for IVM in EG + water mixtures at 298.2-313.2 K
The solubility of IVM in water at 298.2 K (xm = 4.97 × 10⁻⁶) measured in this study was compared with the literature data which were 5.60 × 10-6,11 demonstrating the close agreement and validity of the results from this study.
Solubility data modeling
The solubility data of IVM in EG + water mixtures were correlated using five thermodynamic models: van’t Hoff, Jouyban-Acree, Jouyban-Acree-van’t Hoff, MRS, and modified Wilson, with the fitting results summarized in Tables 3-6. The models were evaluated based on their MRD% between the calculated and measured data. In Table 3, the van’t Hoff model showed overall MRD% values of 5.7% indicate that the van’t Hoff model successfully predicted the solubility of IVM in this system. Additionally, the parameters A and B for the van’t Hoff model were also listed in Table 3. Table 4 summarizes the parameters for both Jouyban-Acree-based models, with calculated MRD% values of 9.1% (Jouyban-Acree) and 11.4% (Jouyban-Acree-van’t Hoff) for the system. Table 5 also detailed the constants of the MRS model for different temperatures and provided the MRD% values for the solubility of IVM in EG + water mixtures. The MRD% value for the back-calculated solubility data was 13.7% suggesting that the MRS model demonstrates acceptable predictive accuracy in this system. Table 6 displays the temperature-dependent parameters of the modified Wilson model and their associated MRD% values. The overall MRD% value for the back-calculated IVM solubility data was 12.1% indicating relatively good predictive performance for this system. Notably, all models showed similar predictive capability, as evidenced by the small variations in their MRD% values.
Table 3.
The van’t Hoff model constants and the MRD% for backcalculated data for IVM in EG + water mixtures
|
w1
|
van’t Hoff model
|
|
A
|
B
|
MRD
%
|
| 0.00 |
13.279 |
-7564.967 |
11.1 |
| 0.10 |
14.636 |
-7843.301 |
10.6 |
| 0.30 |
13.157 |
-7373.193 |
10.1 |
| 0.50 |
8.946 |
-5945.573 |
1.85 |
| 0.70 |
7.806 |
-5501.914 |
3.1 |
| 0.90 |
-1.618 |
-2313.366 |
2.5 |
| 1.00 |
-4.898 |
-991.615 |
0.4 |
| Overall MRD% |
5.7 |
Table 4.
The Jouyban-Acree, and Jouyban-Acree-van’t Hoff model constants and the MRD% for backcalculated data for IVM in EG + water mixtures
|
Jouyban-Acree
|
|
Jouyban-Acree-van’t Hoff
|
|
J0
|
-1018.593 |
A1
|
-4.898 |
|
J1
|
-1329.061 |
B1
|
-991.615 |
|
J2
|
0a |
A2
|
13.279 |
|
|
|
B2
|
-7564.967 |
|
|
|
J0
|
-1018.094 |
|
|
|
J1
|
-1328.704 |
|
|
|
J2
|
0a |
| MRD% |
9.1 |
11.4 |
a Not statistically significant (P value > 0.05).
Table 5.
The MRS model constants and the MRD% for backcalculated data for IVM in EG + water mixtures
|
T
(K)
|
β1
|
β2
|
β3
|
β4
|
β5
|
MRD%
|
| 298.2 |
-9.657 |
-12.338 |
0a |
0.030 |
0a |
16.0 |
| 303.2 |
-9.624 |
-11.565 |
0a |
0.031 |
0a |
15.9 |
| 308.2 |
-9.293 |
-11.225 |
0a |
0.025 |
0a |
12.1 |
| 313.2 |
-9.189 |
-10.950 |
0a |
0.023 |
0a |
10.7 |
| Overall MRD% |
|
13.7 |
a Not statistically significant (P value > 0.05)
Table 6.
The modified Wilson model constants and the MRD% for backcalculated data for IVM in EG + water mixtures
|
T
(K)
|
modified Wilson model
|
|
λ12
|
λ21
|
MRD%
|
| 298.2 |
3.106 |
0.322 |
11.5 |
| 303.2 |
3.850 |
0.260 |
11.5 |
| 308.2 |
3.171 |
0.315 |
11.6 |
| 313.2 |
3.042 |
0.329 |
13.8 |
| Overall MRD% |
|
12.1 |
To further investigate the predictive capability of the Jouyban-Acree-van’t Hoff model, a training method was employed with a minimal set of data points. The pure solvent data (all temperatures) and selected mixture data (0.3, 0.5, and 0.7 mass fractions at 298.2 K) were used for model training, and the it was used for solubility prediction across untested conditions. The prediction MRD% values obtained were 10.9%, 17.6%, 17.3%, and 13.8% at various temperatures, respectively.
Table 7 presented the Napierian logarithmic activity constants of IVM in EG-water binary mixtures, as determined by the NRTL model.26 The findings indicated that IVM solubility increases when its activity coefficient decreases, which is attributed to stronger interactions between IVM molecules and the EG-rich mixture.27 This relationship was further illustrated in Figure 4.
Table 7.
The calculated ln (γ) of IVM in the aqueous mixtures of EG based on NRTL model at T = (298.2–313.2) K
|
w1
|
ln (γ)
|
|
298.2 K
|
303.2 K
|
308.2 K
|
313.2 K
|
| 0.00 |
4.665 |
4.378 |
4.449 |
4.608 |
| 0.10 |
4.246 |
3.921 |
4.022 |
4.125 |
| 0.30 |
4.13 |
3.895 |
3.94 |
4.111 |
| 0.50 |
3.453 |
3.534 |
3.558 |
3.69 |
| 0.70 |
3.095 |
3.231 |
3.234 |
3.423 |
| 0.90 |
1.838 |
2.118 |
2.322 |
2.668 |
| 1.00 |
0.681 |
1.018 |
1.366 |
1.697 |
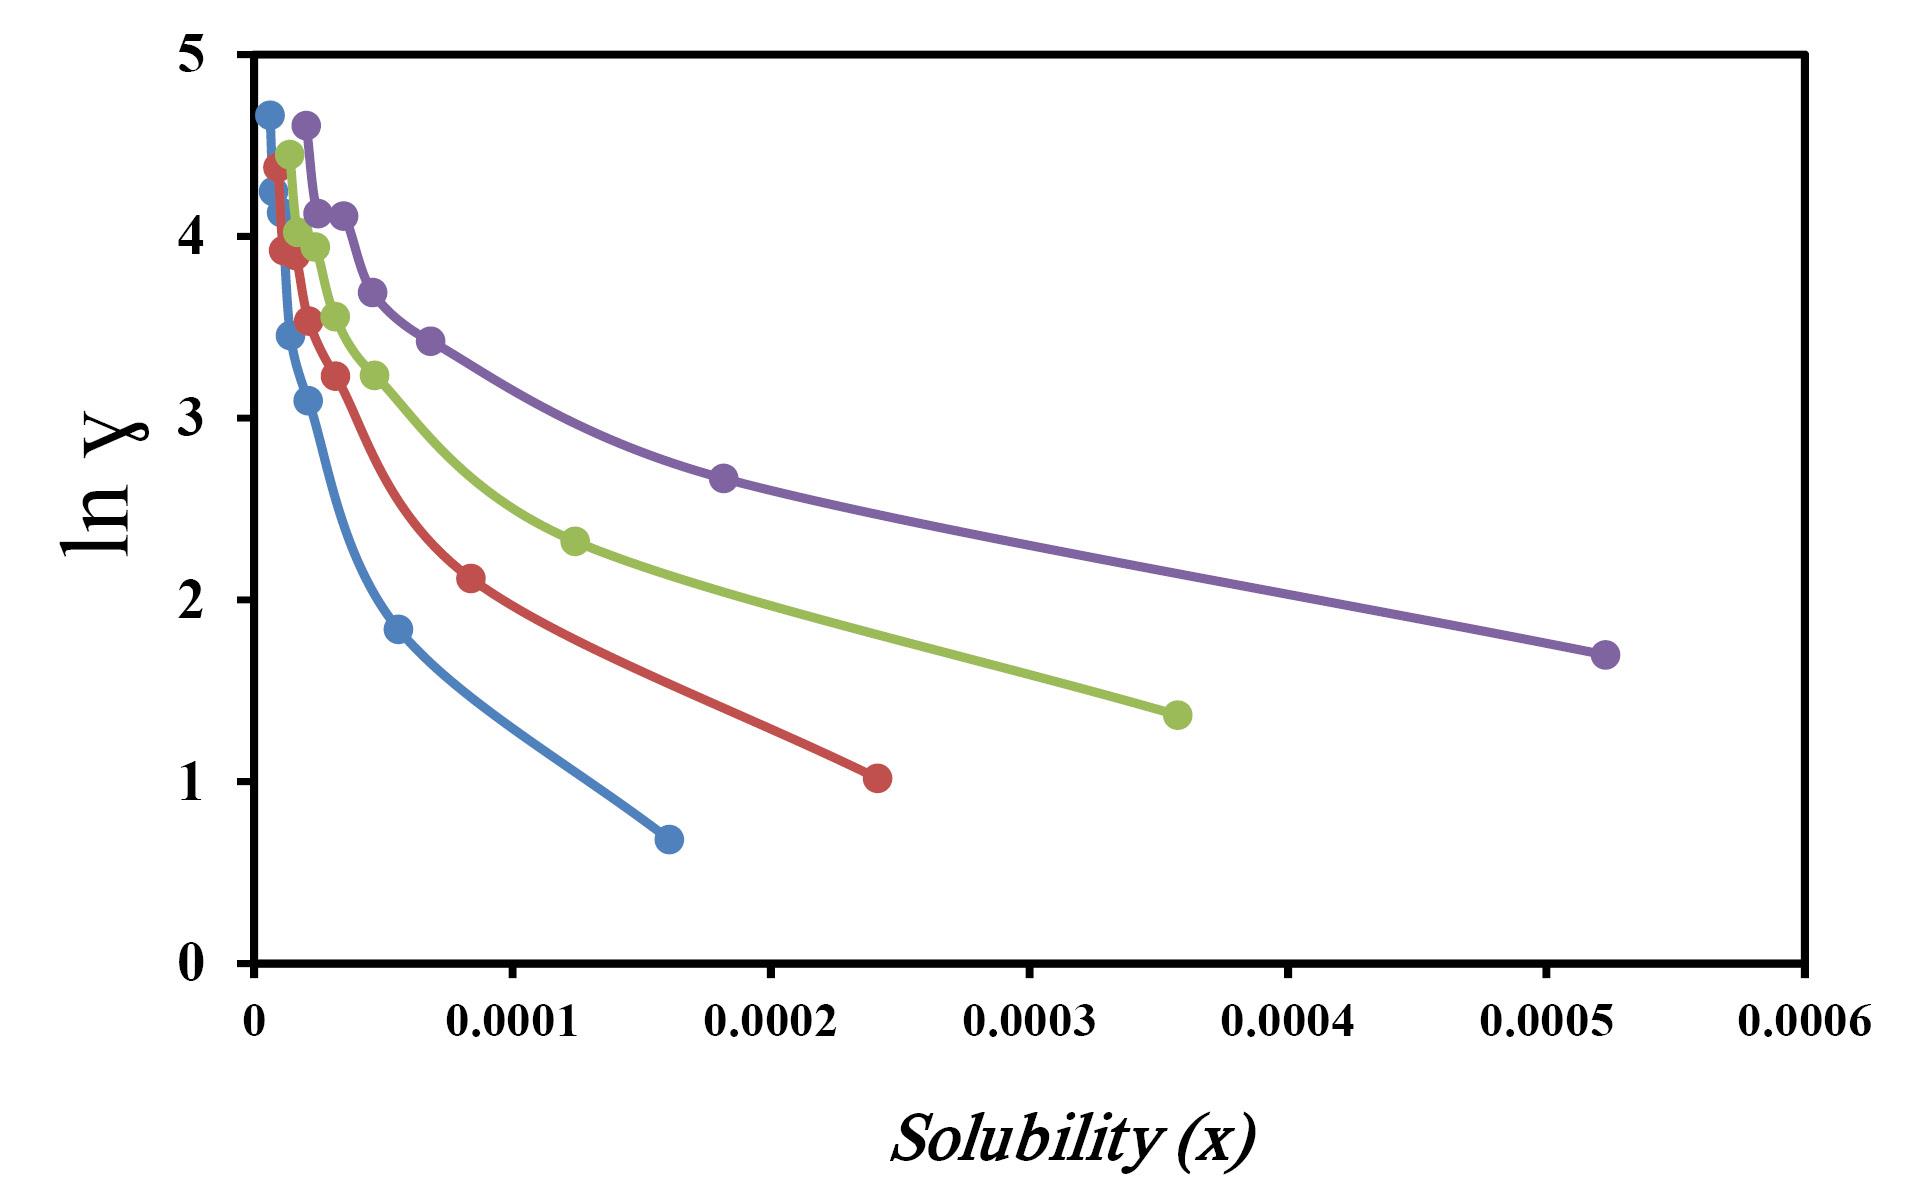
Figure 4.
The relationship of calculated solubility x (IVM) with NRTL model and activity coefficient (γ) for IVM in the aqueous mixtures of EG from NRTL model at investigated temperature
.
The relationship of calculated solubility x (IVM) with NRTL model and activity coefficient (γ) for IVM in the aqueous mixtures of EG from NRTL model at investigated temperature
Hansen solubility parameter
Choosing suitable solvents serves as the foundation for effective solvent replacement. The Hansen Solubility Parameters (HSP) method provides a simple and efficient way to predict and choose suitable solvent mixtures based on solubility data. Hildebrand and Scott proposed the solubility parameter (δ) concept, establishing that components with comparable δ values demonstrate greater miscibility and enhanced solubility.28 Hansen’s theory establishes that a component’s solubility parameter (δ) comprises three contributions: hydrogen bonding, polar interactions, and dispersion forces.29 The total solubility parameter (Hildebrand, δₜ) represents the square root of the sum of the squares of the three HSP components. Comparing these parameters helps quantify solvent-solute compatibility. The following mathematical relationship was proposed by Hansen to calculate the HSP difference between solvent and solute components:
(12)
where Δδi;j denotes to the dissimilarity factor, and the j and i superscripts relates to the solute and the solvent, respectively. Table 8 presents the obtained δd (dispersion), δ ₚ (polar), and δ ₕ (hydrogen bonding) parameters for IVM, EG, and water. The data indicate that the δd and δ ₚ of IVM play a significant role in its solubility behavior due to the similarity in parameters with EG. Notably, the lower Δδ values observed for IVM in EG compared to water indicate stronger compatibility, explaining why IVM demonstrates greater solubility in EG-water mixtures than in neat aqueous solutions. This behavior aligns with HSP theory, where smaller Δδ values correlate with improved miscibility.
Table 8.
The HSP for the materials
|
Name
|
δd(MPa1/2)
|
δp(MPa1/2)
|
δh(MPa1/2)
|
δt(MPa1/2)
|
| Water |
15.5 |
16.0 |
42.3 |
47.8 |
| EG |
17.0 |
11.0 |
26.0 |
32.95 |
| IVM |
18.09 |
12.72 |
9.59 |
24.11 |
|
Δ δ
i;j
|
|
Solute
|
Co-solvent
|
| IVM |
EG |
|
water |
|
|
|
16.64 |
|
33.27 |
Computation of apparent thermodynamic properties
Table 9 presented the apparent thermodynamic factors of the IVM dissolution in EG + water system at 305.6 K. The factors included ΔG°, ΔH°, ΔS°, TΔS°, ζH, and ζTS. The thermodynamic analysis showed favorable dissolution of IVM in these mixtures, though positive ΔG° values demonstrated the process was non-spontaneous at saturation, while the positive ΔH° values showed an endothermic reaction, indicating that heat was absorbed during the dissolution. Moreover, the positive ΔS° values (except for EG mass fractions of 0.9 and 1.0) suggested that entropy played a beneficial role in the dissolution process. Moreover, as evidenced by ζH being greater than ζTS (except for neat EG), the enthalpy contribution played a dominant role in these mixtures. This showed that a significant amount of energy was needed to overcome the interactions between the drug, solvent, and co-solvent. In summary, IVM dissolution in EG-water mixtures was thermodynamically favorable, primarily governed by decreasing ΔG° and endothermic behavior.
Table 9.
Apparent thermodynamic parameters of IVM dissolution in EG + water mixtures at Thm = 305.6 K and ambient pressure (≈ 85 kPa)
|
w1
|
ΔG°
(kJ.mol–1)
|
ΔH
°
(kJ.mol–1)
|
ΔS°
(J.K–1.mol–1)
|
TΔS°
(kJ.mol–1)
|
ζH
|
ζTS
|
| 0.00 |
29.16 |
62.90 |
110.41 |
33.74 |
0.651 |
0.349 |
| 0.10 |
28.02 |
65.21 |
121.68 |
37.18 |
0.637 |
0.363 |
| 0.30 |
27.87 |
61.30 |
109.39 |
33.43 |
0.647 |
0.353 |
| 0.50 |
26.70 |
49.43 |
74.37 |
22.73 |
0.685 |
0.315 |
| 0.70 |
25.91 |
45.74 |
64.90 |
19.83 |
0.698 |
0.302 |
| 0.90 |
23.34 |
19.23 |
-13.45 |
-4.11 |
0.824 |
0.176 |
| 1.00 |
20.69 |
8.24 |
-40.72 |
-12.44 |
0.399 |
0.601 |
Enthalpy–entropy compensation analysis
Figure 5 presented the enthalpy-entropy compensation plot, which showed the relationship between ΔH° and ΔG° regarding the solubility of IVM in EG + water mixtures at Thm. The plot elucidated the respective contributions of ΔS° and enthalpy ΔH° changes to the dissolution thermodynamics. In Figure 5, the negative slope observed for mass fractions ranging from 0.0 to 0.1 indicates that the solubility enhancement of IVM in this range was primarily driven by entropic effects. This suggests that at low co-solvent concentrations, the increase in solubility arose from greater molecular disorder or improved solvent mixing, rather than strong energetic interactions. In contrast, the positive slope seen at higher mass fractions (0.1–1.0) implies that solubility enhancement in this region was more influenced by enthalpic contributions, where favorable solute-solvent interactions, such as hydrogen bonding or van der Waals forces, played a dominant role. The study revealed enthalpy-entropy compensation behavior, with progressive ΔH° enhancement during dissolution being compensated by commensurate ΔS° elevation, manifesting as a linear ΔH°-ΔS° relationship. This compensation effect demonstrated that both entropy and enthalpy were key factors governing IVM dissolution, with entropic effects prevailing at low co-solvent fractions and enthalpic effects becoming more significant at higher concentrations. The interplay between these thermodynamic parameters ensured a balanced solubility profile across the entire solvent composition range.
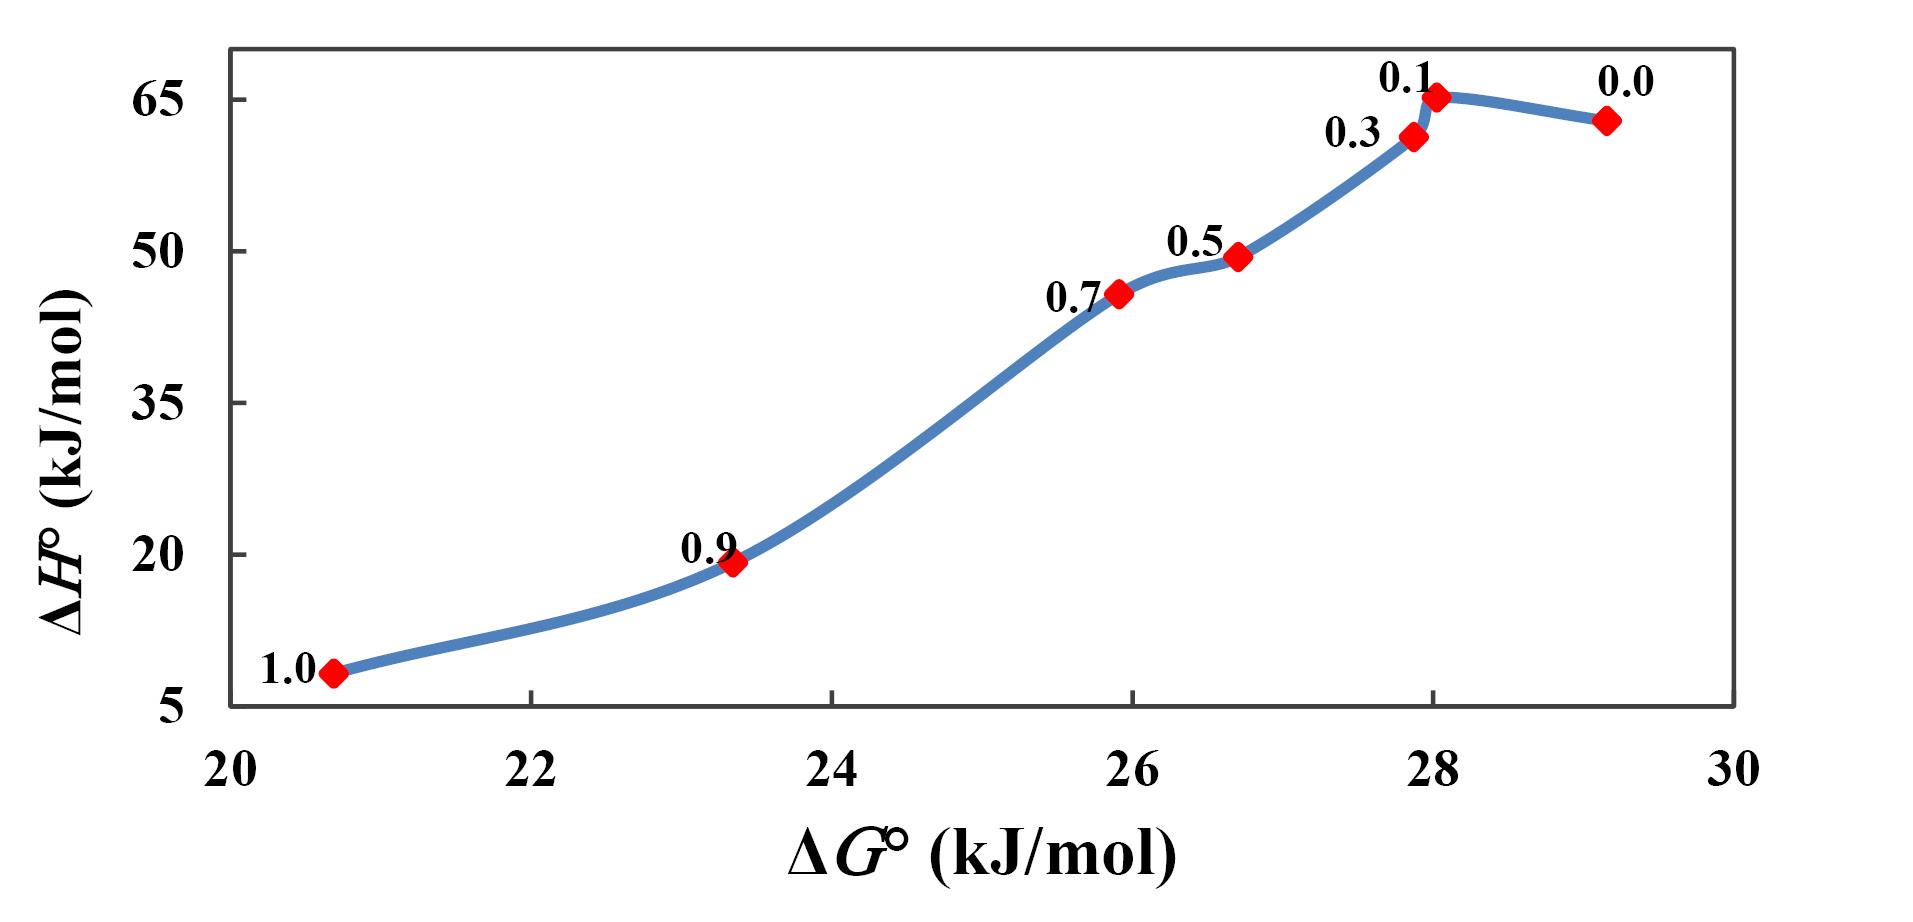
Figure 5.
Enthalpy-entropy compensation plot for the IVM solubility in EG + water mixtures at Thm = 305.6 K. The solid data points represent the EG mass fractions in the binary solvent mixtures prior to IVM addition
.
Enthalpy-entropy compensation plot for the IVM solubility in EG + water mixtures at Thm = 305.6 K. The solid data points represent the EG mass fractions in the binary solvent mixtures prior to IVM addition
Conclusion
This work investigated the temperature-dependent solubility and dissolution thermodynamics of IVM in binary EG + water solvent systems. The results showed that in the EG -rich mixtures and proportional to temperature, the IVM solubility significantly increased. While manual experimental methods yield reliable solubility data, they present several limitations including impracticality, labor-intensive procedures, time consumption, and high costs. A promising approach involves employing mathematical predictive models to estimate solubility, enabling interpolation between experimental data points and identification of potential outliers. Some of well-known methods were employed herein to correlate and back-calculate the IVM solubility data. These models effectively predicted IVM solubility in the binary solvent mixtures, achieving an MRD% of 5.7 for the van’t Hoff, 9.1 for the Jouyban-Acree, 11.4 for the Jouyban-Acree-van’t Hoff, 13.7 for the MRS, and 12.1 for the modified Wilson models concluding that these models served as effective tools for predicting solubility in alternative solvent systems and determining key thermodynamic properties. Moreover, in the thermodynamic analysis, positive ΔG° values indicating a non-spontaneous manner of dissolution process, the positive ΔH° values showing an endothermic reaction, and the positive ΔS° values (except for EG mass fractions of 0.9 and 1.0) suggesting the beneficial role of the entropy in the dissolution process.
Competing Interests
The authors declare that they have no competing interests.
Consent for Publication
Not applicable
Data Availability Statement
The datasets used and/or analysed during the current study are available from the corresponding author on reasonable request.
Ethical Approval
Not applicable.
References
- Crump A, Ōmura S. Ivermectin, ‘wonder drug’ from Japan: the human use perspective. Proc Jpn Acad Ser B Phys Biol Sci 2011; 87(2):13-28. doi: 10.2183/pjab.87.13 [Crossref] [ Google Scholar]
- Daurio CP, Cheung EN, Jeffcoat AR, Skelly BJ. Bioavailability of ivermectin administered orally to dogs. Vet Res Commun 1992; 16(2):125-30. doi: 10.1007/bf01839009 [Crossref] [ Google Scholar]
-
Fink DW, Porras AG. Pharmacokinetics of ivermectin in animals and humans. In: Campbell WC, ed. Ivermectin and Abamectin. New York: Springer; 1989. p. 113-30. doi: 10.1007/978-1-4612-3626-9_7.
- Yılmaz M, Toprak C, Gün G, Özbek M. Development of bulk homogenity with formulation of ivermectin tablet by geometric blending. Res Rev J Pharm Pharm Sci 2021; 10(2):1-8. [ Google Scholar]
- Mohammadian E, Barzegar-Jalali M, Rahimpour E. Solubility prediction of lamotrigine in cosolvency systems using Abraham and Hansen solvation parameters. J Mol Liq 2019; 276:675-9. doi: 10.1016/j.molliq.2018.12.043 [Crossref] [ Google Scholar]
- Sareen S, Mathew G, Joseph L. Improvement in solubility of poor water-soluble drugs by solid dispersion. Int J Pharm Investig 2012; 2(1):12-7. doi: 10.4103/2230-973x.96921 [Crossref] [ Google Scholar]
- Jouyban A. Review of the cosolvency models for predicting solubility in solvent mixtures: an update. J Pharm Pharm Sci 2019; 22(1):466-85. doi: 10.18433/jpps30611 [Crossref] [ Google Scholar]
- Camargo JA, Sapin A, Nouvel C, Daloz D, Leonard M, Bonneaux F. Injectable PLA-based in situ forming implants for controlled release of Ivermectin a BCS Class II drug: solvent selection based on physico-chemical characterization. Drug Dev Ind Pharm 2013; 39(1):146-55. doi: 10.3109/03639045.2012.660952 [Crossref] [ Google Scholar]
- Patel VP, Lakkad HA, Ashara KC. Formulation studies of solid self-emulsifying drug delivery system of ivermectin. Folia Med (Plovdiv) 2018; 60(4):580-93. doi: 10.2478/folmed-2018-0024 [Crossref] [ Google Scholar]
- Xu H, Jiang L, Wang L. Determination and correlation of solubilities of ivermectin in alcohol and alcohol-water mixture. J Nanjing Univ Sci Technol 2014; 38:173-80. [ Google Scholar]
- Khezri S, Ghotaslou R, Poturcu K, Soleymani J, Rahimpour E, Jouyban A. Solubility and thermodynamics of ivermectin in aqueous mixtures of 1-propanol/2-propanol. J Solution Chem 2025; 54(1):92-108. doi: 10.1007/s10953-024-01416-1 [Crossref] [ Google Scholar]
- Rahimpour E, Jouyban A. A simple strategy for washing a recrystallized drug from viscous and non-volatile solvents prior to XRD study: a technical note. Rev Colomb Cienc Quim Farm 2023; 52(1):107-13. doi: 10.15446/rcciquifa.v52n1.109364 [Crossref] [ Google Scholar]
- Jouyban-Gharamaleki V, Jouyban A, Kuentz M, Hemmati S, Martinez F, Rahimpour E. A laser monitoring technique for determination of mesalazine solubility in propylene glycol and ethanol mixtures at various temperatures. J Mol Liq 2020; 304:112714. doi: 10.1016/j.molliq.2020.112714 [Crossref] [ Google Scholar]
- Zarghampour A, Jouyban K, Jouyban-Gharamaleki V, Jouyban A, Rahimpour E. A description on the shake-flask and laser monitoring-based techniques for determination of the drug’s solubility. Pharm Sci 2024; 30(2):274-8. doi: 10.34172/ps.2024.2 [Crossref] [ Google Scholar]
- Grant DJ, Mehdizadeh M, Chow AH, Fairbrother JE. Non-linear van’t Hoff solubility-temperature plots and their pharmaceutical interpretation. Int J Pharm 1984; 18(1-2):25-38. doi: 10.1016/0378-5173(84)90104-2 [Crossref] [ Google Scholar]
- Ochsner AB, Belloto RJ, Jr Jr, Sokoloski TD. Prediction of xanthine solubilities using statistical techniques. J Pharm Sci 1985; 74(2):132-5. doi: 10.1002/jps.2600740206 [Crossref] [ Google Scholar]
- Jouyban A, Acree WE Jr. Mathematical derivation of the Jouyban-Acree model to represent solute solubility data in mixed solvents at various temperatures. J Mol Liq 2018; 256:541-7. doi: 10.1016/j.molliq.2018.01.171 [Crossref] [ Google Scholar]
- Jouyban-Gharamaleki A. The modified Wilson model and predicting drug solubility in water-cosolvent mixtures. Chem Pharm Bull 1998; 46(6):1058-61. doi: 10.1248/cpb.46.1058 [Crossref] [ Google Scholar]
- Perlovich GL, Kurkov SV, Bauer-Brandl A. Thermodynamics of solutions II Flurbiprofen and diflunisal as models for studying solvation of drug substances. Eur J Pharm Sci 2003; 19(5):423-32. doi: 10.1016/s0928-0987(03)00145-3 [Crossref] [ Google Scholar]
- Lu M, Xiong D, Sun W, Yu T, Hu Z, Ding J. Sustained release ivermectin-loaded solid lipid dispersion for subcutaneous delivery: in vitro and in vivo evaluation. Drug Deliv 2017; 24(1):622-31. doi: 10.1080/10717544.2017.1284945 [Crossref] [ Google Scholar]
- Li WL, Zhou CR, Zhang L. Investigation on specific heat capacity and combustion enthalpy of ivermectin. J Therm Anal Calorim 2016; 124(1):447-53. doi: 10.1007/s10973-015-5111-1 [Crossref] [ Google Scholar]
- Rana M, Yadav P, Lakhera S, Chowdhury P. Ivermectin and doxycycline combination as a promising anti-viral drug candidate: an in-silico and DFT study. 2023. Res Sq [Preprint]. January 16, 2023Available from: https://www.researchsquare.com/article/rs-2471515/v1.
- Aerts J. The Hoy Solubility Parameter Calculation Software. Germany: Computer Chemistry Counsultancy; 2005.
- Zhu T, Van Voorhis T. Understanding the dipole moment of liquid water from a self-attractive Hartree decomposition. J Phys Chem Lett 2021; 12(1):6-12. doi: 10.1021/acs.jpclett.0c03300 [Crossref] [ Google Scholar]
- Malmberg CG, Maryott AA. Dielectric constant of water from 0 to 100 C. J Res Natl Bur Stand (1977) 1956; 56(1):1-8. [ Google Scholar]
- Behboudi E, Soleymani J, Martinez F, Jouyban A. Solubility of amlodipine besylate in acetonitrile + water binary mixtures at various temperatures: determination, modelling, and thermodynamics. Phys Chem Liq 2022; 60(6):892-909. doi: 10.1080/00319104.2022.2068012 [Crossref] [ Google Scholar]
- Kasagić-Vujanović I, Knežević D. Design of experiments in optimization and validation of hydrophilic interaction liquid chromatography method for determination of amlodipine besylate and its impurities. Acta Chromatogr 2021; 34(1):41-52. doi: 10.1080/10826076.2014.991872 [Crossref] [ Google Scholar]
- Hildebrand JH, Robert LS. Regular solutions. Inorg Chem 1963; 2:431-2. [ Google Scholar]
- Hansen CM. The Three-Dimensional Solubility Parameter. Copenhagen: Danish Technical Press; 1967.