Pharmaceutical Sciences. 31(4):379-390.
doi: 10.34172/PS.025.42523
Research Article
Green HPLC Assay for Captopril Tablets with Integrated Laboratory Waste Management: A Paradigm of Sustainable Pharmaceutical Analysis Workflow Enabled by Agro-Waste-Derived Products
Kanong Ruttanakorn Formal analysis, Funding acquisition, Methodology, Writing – original draft, 1 
Thana Thanayutsiri Investigation, Visualization, 1
Praneet Opanasopit Formal analysis, Writing – original draft, 1
Tanasait Ngawhirunpat Formal analysis, 1
Akhayachatra Chinsriwongkul Resources, 2
Theerasak Rojanarata Conceptualization, Formal analysis, Funding acquisition, Methodology, Project administration, Writing – review & editing, 1, *
Author information:
1Faculty of Pharmacy, Silpakorn University, Sanam Chandra Palace Campus, Nakhon Pathom 73000, Thailand
2Newcharoen Pharmaceutical L.P., Pathumthani 12120, Thailand
Abstract
Background:
Sustainable pharmaceutical analysis is essential for reducing environmental impacts from hazardous reagents, solvents, and residual active pharmaceutical ingredients (APIs). This study aimed to develop a green and practical workflow by integrating an eco-friendly analytical method with an effective post-analysis waste treatment approach, using captopril (CTP) as a case study.
Methods:
A high-performance liquid chromatographic (HPLC) method was developed for rapid, simultaneous quantification of CTP and its impurity, captopril disulfide (CDS), in tablet formulations. Bioethanol derived from sugarcane molasses was used as a greener alternative to conventional solvents. A 10 cm C18-column was employed to address ethanol-associated backpressure. The method was validated following ICH and United States Pharmacopeia (USP) guidelines. In parallel, a laboratory waste treatment protocol was developed using coconut shell-derived activated carbon, applied at ambient temperature (25 °C).
Results:
The optimized HPLC method, utilizing a mobile phase of ethanol, water, and phosphoric acid (35:65:0.05, v/v/v), operated at a flow rate of 1.5 mL/min and a column temperature of 40 °C, effectively resolved CTP and CDS within 2.5 min, allowing for high-throughput analysis and reduced energy consumption. It demonstrated excellent linearity, accuracy, precision, sensitivity, specificity, and robustness. Its performance was comparable to the USP reference method, with the added benefits of improved greenness and practicality. Treatment of the laboratory waste liquid by shaking with activated carbon at a 1:10 g/mL ratio removed over 99% of CTP within 5 min.
Conclusion:
This is the first ethanol-based HPLC assay for CTP, offering a greener alternative to existing methods. The integrated waste management strategy effectively reduces risk of API dissemination into the environment, addressing both ecological and public health concerns. Utilizing agro-waste in both analysis and waste treatment promotes resource efficiency and supports circular economy principles. This model contributes to sustainable pharmaceutical quality control in line with the Sustainable Development Goals.
Keywords: HPLC, Assay, Waste treatment, Captopril, Bioethanol, Activated carbon
Copyright and License Information
© 2025 The Author(s).
This is an open access article and applies the Creative Commons Attribution Non-Commercial License (
http://creativecommons.org/licenses/by-nc/4.0/). Non-commercial uses of the work are permitted, provided the original work is properly cited.
Funding Statement
This research is financially supported by Thailand Science Research and Innovation (TSRI), the National Science, Research and Innovation Fund (NSRF) for the fiscal year 2025, and the Faculty of Pharmacy, Silpakorn University.
Introduction
High-performance liquid chromatography (HPLC) plays a pivotal role in pharmaceutical analysis, ensuring the quality, efficacy, and safety of drugs. However, HPLC methods, particularly those utilizing the reverse-phase mode, rely extensively on organic solvents such as acetonitrile and methanol. These solvents, derived from non-renewable petrochemical sources, pose health and environmental risks due to their toxicity. Such concerns underscore the urgent need for greener solvents that align with the principles of green chemistry and sustainability. Among the available alternatives, a promising solution lies in replacing conventional solvents with ethanol.1-4 With its favorable safety profile, biodegradability, and production from renewable feedstocks such as agricultural waste, ethanol-based HPLC has garnered increasing attention in pharmaceutical analysis. This approach has been successfully applied to the analysis of various drugs.5-10 However, despite its advantages, ethanol-based HPLC remains underutilized in routine pharmaceutical analysis, highlighting the need for further research to optimize its application across diverse drug assays.
In addition to the safety concerns associated with solvents, the disposal of waste containing active pharmaceutical ingredients (APIs) has become a significant environmental issue.11-15 Pharmaceutical residues can seep into wastewater streams, potentially harming aquatic ecosystems and posing risks to human health. Although waste from laboratory analyses does not primarily contribute to pharmaceutical pollution compared to waste from pharmaceutical manufacturing and consumer drug excretion, large pharmaceutical companies operate hundreds of liquid chromatographs in their research, development, and quality control laboratories. This results in the daily generation of thousands of liters of waste containing organic solvents and APIs.4 Therefore, minimizing waste generation and implementing proper waste treatment in laboratories are essential practices to prevent the problem from escalating. This underscores the need for more sustainable and effective waste management strategies prior to emissions into the environment that are seamlessly integrated into the analytical workflow.
Among various waste treatment approaches, adsorption using activated carbon has been recognized as one of the most efficient and cost-effective methods for removing pharmaceutical contaminants from effluents. As a sustainable solution for wastewater treatment, activated carbon demonstrates a high adsorption capacity for APIs, significantly reducing their presence in liquid waste. Notably, studies have shown that activated carbon derived from agricultural byproducts—such as coconut shells, rice husks, and other residues—offers comparable or even superior performance to non-renewable sources such as coal, which may raise concerns about environmental impact and resource depletion.16-20 This approach, therefore, not only mitigates pharmaceutical pollution but also upcycles agricultural waste into valuable products, aligning with the principles of circular economy and sustainable development.
While previous research has explored individual strategies—either solvent substitution through the development of ethanol-based HPLC methods or waste treatment by investigating the production of adsorbents and evaluating their adsorption efficiency—an important gap remains in integrating both approaches into a unified framework. Furthermore, very few existing studies have successfully connected these green strategies by leveraging the shared potential of agricultural waste-derived products. Developing such an integrated approach would not only enhance the sustainability of pharmaceutical analysis but also promote the valorization of agricultural waste in green chemistry applications.
Captopril (CTP) (Figure 1a), an angiotensin-converting enzyme (ACE) inhibitor, is commonly used for the treatment of hypertension and heart failure. The current pharmacopeial methods for captopril assay, as outlined in the United States Pharmacopeia (USP) and European Pharmacopeia (EP) and some literatures, rely on HPLC with acetonitrile or methanol as mobile phase components.21-25 Despite good analytical performance, these methods raise environmental and safety concerns due to the solvents’ toxicity. Furthermore, captopril has become an environmental pollutant, detected in wastewater, surface waters, and even drinking water sources.16,26-28 Its presence has been shown to disrupt aquatic ecosystems and produce toxic effects in fish.29,30 This highlights the urgent need for better waste treatment strategies to mitigate its environmental impact.
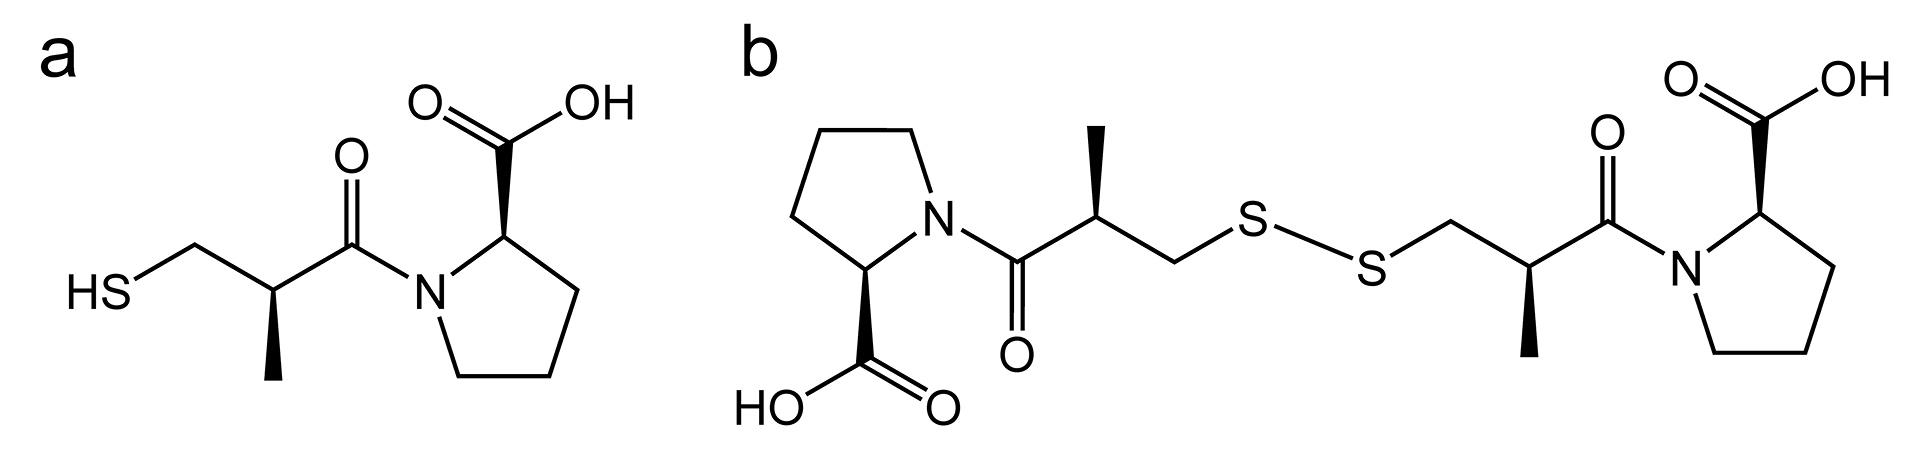
Figure 1.
Chemical structures of captopril (a) and captopril disulfide (b)
.
Chemical structures of captopril (a) and captopril disulfide (b)
To date, no ethanol-based HPLC method has been reported for the assay of CTP. This study aims to develop a comprehensive methodology for quantifying CTP in tablets while integrating post-assay waste management using agro-waste-derived products. Additionally, since pharmacopeial regulations require controlling its dimer impurity, captopril disulfide (CDS) (Figure 1b), with a set limit of 3%,22,23 this work aims to establish an assay that enables the simultaneous quantification of both CTP and CDS. By replacing unsafe solvents with bioethanol sourced from sugarcane molasses, the approach minimizes health and environmental risks while maintaining analytical performance. Additionally, the use of activated carbon produced from coconut shells for waste treatment effectively removes pharmaceutical residues before disposal, reducing the potential for environmental contamination. Moreover, as the products used in this study were locally sourced, they enhance economic sustainability within the domestic agricultural sector. Collectively, this study presents the first ethanol-based HPLC assay for CTP tablets that integrates laboratory waste management using agro-waste-derived materials—offering a green analytical workflow that supports both pharmaceutical quality control and broader environmental and economic sustainability goals.
Materials and Methods
Chemicals and reagents
CTP (99.6% purity) and its dimer impurity, CDS (99.6% purity), were obtained from Sigma Aldrich (Missouri, USA). Commercial CTP tablets, each containing 25 mg of the active ingredient, were sourced from a hospital in Thailand. Bioethanol derived from sugarcane molasses was generously supplied by Mitr Phol Biofuel Co., Ltd. (Bangkok, Thailand). It was produced through fermentation and further purified to meet fuel additive specifications, achieving a purity of 99.97% as confirmed by gas chromatography.
The activated carbon used for analytical waste treatment was kindly provided by Coconut Carbon (Thai) Company (Phetchaburi, Thailand). It was produced from coconut shells using a non-chemical activation method involving two main steps: (1) carbonization, where cleaned, dried, and crushed coconut shells were heated in a low-oxygen atmosphere at 400–600 °C to form char, and (2) steam activation, in which the char was treated with high-temperature steam (700–1000 °C) to enhance porosity by removing volatile components and increasing the surface area. The final product had a particle size of 70 mesh (0.21 mm), a surface area exceeding 1300 m2/g, and a minimum iodine value of 1100 mg/g.
All other reagents and chemicals used were of analytical grade, and deionized water was employed throughout the study.
Preparation of standard solutions and sample solutions
For the simultaneous quantification of CTP and CDS, calibration curves were established for both compounds. A stock solution of CTP at 2.5 mg/mL was prepared by dissolving the standard compound in a mobile phase consisting of ethanol, water, and phosphoric acid in the volume ratio of 35:65:0.05. In a similar manner, a 1.0 mg/mL CDS stock solution was prepared. These stock solutions were then diluted using the same diluent to yield working standard solutions for CTP with concentrations of 0.25, 0.5, 0.75, 1.0 and 1.25 mg/mL, and for CDS with concentrations of 0.0125, 0.025, 0.0375, 0.05 and 0.0625 mg/mL, respectively. The prepared standard solutions were injected into the HPLC system to construct the calibration curves for both analytes.
For tablet analysis, twenty tablets were precisely weighed and finely ground. An amount of the resulting powder, equivalent to 25 mg of CTP, was transferred into a 25 mL volumetric flask. Approximately 20 mL of the diluent were added to the flask, and the mixture was sonicated for 20 min or until the tablets were completely disintegrated. The solution was then brought to a final volume of 25 mL with additional diluent and subsequently filtered through a 0.45-μm nylon membrane to obtain the stock sample solution. To prepare the working sample solution at a concentration of 1.0 mg/mL, an appropriate aliquot of this stock solution was further diluted with the diluent. Prior to HPLC analysis, the working samples were filtered again through a 0.45-μm nylon filter to eliminate any remaining particulate matter.
It should be noted that all standard and sample solutions were kept protected from exposure to air.
Chromatographic conditions
In the ethanol-based method, chromatographic analysis of CTP tablets was performed on Agilent 1100 Infinity system using a short reversed-phase column (VertiSepTM GES 4.6 mm ID × 10 cm, 5 µm, Vertical Chromatography Co., Ltd., Bangkok, Thailand). The injection volume for both standard and sample solutions was 20 µL, and detection was carried out at 225 nm using a UV detector. Under these conditions, the retention times for CTP and CDS were approximately 1.3 and 2.0 min, respectively. The concentrations of CTP and CDS in the tablet samples were determined by comparing the corresponding peak areas with those obtained from their respective standard calibration curves.
For validation, the standard method described in USP43-NF3823 was used for comparison. Briefly, both CTP standard and tablet sample solutions were prepared at 1.0 mg/mL. For the limit test of CDS, a 0.05 mg/mL standard solution of CDS was prepared. The analysis was performed on a reversed-phase column (VertiSepTM GES 4.6 mm ID × 25 cm, 5 µm, Vertical Chromatography Co., Ltd., Bangkok, Thailand) using an isocratic elution with a mobile phase containing methanol, water, and phosphoric acid in a 55:45:0.05 (v/v/v) ratio, at a flow rate of 1.0 mL/min. The UV detector was set to 220 nm. The retention times for CTP and CDS were about 6.4 and 12.3 min, respectively. The amounts of CTP and CDS in the tablet sample were calculated using single-point calibration based on the peak areas of both the sample and standard solutions.
Analytical method validation
The proposed method was validated following ICH guidelines Q2 (R1)31 and USP < 1225 > Validation of Compendial Methods.23 Linearity, range, and sensitivity were assessed using regression equations derived from the standard curves of CTP and CDS, prepared in the range of 0.25–1.25 mg/mL and 0.0125–0.0625 mg/mL, respectively. The method was considered linear if the coefficient of determination (r2) exceeded 0.99. The limit of detection (LOD) and limit of quantification (LOQ) were calculated as LOD = 3.3𝜎/S and LOQ = 10𝜎/S, where σ is the standard deviation of the response, and S is the slope of the calibration curve.
Accuracy was evaluated through a recovery study, where CTP and CDS standards were spiked into a tablet placebo (a mixture of excipients) at three concentration levels, each analyzed in triplicate. The CTP assay was performed at 0.8, 1.0, and 1.2 mg/mL, corresponding to 80%, 100%, and 120% of the target concentration (1.0 mg/mL). The quantitation of CDS impurity was conducted at 0.015, 0.030, and 0.045 mg/mL, representing 50%, 100%, and 150% of the target concentration (0.030 mg/mL). After HPLC analysis, % recovery was calculated for each replicate. The method was considered accurate if the % recovery fell within 98%–102% for CTP (API) and 97%–103% for CDS (impurity) across all tested concentrations.
Precision was assessed through intra-day and inter-day studies. Intra-day precision was determined by analyzing six replicates of tablet samples within a single day, while inter-day precision was assessed by analyzing the same concentration over three different days. The method was considered precise if the % RSD for repeatability (intra-day precision) did not exceed 2% for CTP and 2.7% for CDS. For reproducibility (inter-day precision) the % RSD should be below 2% for CTP and 4% for CDS.
Specificity was evaluated by assessing peak separation and purity. Retention times of CTP and CDS were compared with those of blank and placebo solutions to ensure no overlapping peaks. Peak purity was confirmed using a diode-array detector (DAD), where a purity value higher than the purity threshold indicated no co-eluting impurities.
Robustness was assessed by introducing small deliberate changes to method parameters. Three replicates of the sample solutions were analyzed under variations in flow rate ( ± 0.2 mL/min), column temperature ( ± 3°C), mobile phase composition ( ± 2% ethanol), and wavelength ( ± 3 nm). One parameter was altered per trial to evaluate its effect on the % labeled amount. The method was considered robust if the % RSD remained below 2% and 2.7% for CTP and CDS, respectively.
Solution stability was evaluated by analyzing triplicate standard and sample preparations at ambient room temperature immediately after preparation and after 8 hours. The solutions were considered stable if the % difference in assay results between the initial and 8-h measurements did not exceed ± 2%.
Comparison of the proposed method and the pharmacopeial method
After validation, the analytical performance of the proposed method was confirmed by determining the CTP content (expressed as % labeled amount) and CDS levels in commercial tablet samples (n = 6), compared to the USP methods. A Student’s t-test (P = 0.05) was used to compare the assay results between the two methods. Additionally, the greenness and practicality of the proposed method were assessed using the Analytical GREEnness (AGREE) metric,32 the Green Analytical Procedure Index (GAPI),33 and the Blue Applicability Grade Index (BAGI).34
Development of the analytical waste treatment via adsorption
A practical, rapid, cost-effective method for analytical waste treatment was developed for applications in laboratory. This method utilizes activated carbon derived from coconut shells to adsorb liquid waste generated from solution preparation and HPLC analysis at ambient temperature. The process involves shaking the pooled waste with an optimized amount of activated carbon, in a closed container on a rotary shaker at 300 rpm for a specified duration, followed by filtration through Whatman filter paper No.1. To assess the treatment efficiency and determine the sufficient amount of activated carbon and shaking time for effective adsorption, the CTP concentration in the waste liquid was measured before and after treatment using the proposed HPLC method, and the percentage of CTP remaining was calculated.
Results and Discussion
Optimal conditions for ethanol-based HPLC
Ethanol is considered one of the most environmentally friendly organic solvents, making it an excellent choice for green liquid chromatography.1-4 Compared to acetonitrile and methanol, ethanol is less toxic and has a lower vapor pressure, reducing evaporation and, consequently, the risk of inhalation exposure. Additionally, ethanol is more affordable and widely available, making it a practical option for laboratories with limited resources, especially in developing countries, where it can even be produced locally in many regions. Furthermore, its environmentally compatible waste results in lower disposal costs than acetonitrile and methanol, which is particularly beneficial in regions where chemical-waste management remains expensive. For these reasons, ethanol was selected for the development of a new assay in this study. Moreover, domestically produced bioethanol, derived from sugarcane molasses—an agricultural waste product—was utilized. This bioethanol, with a purity of 99.97% v/v, comparable to commercial HPLC-grade ethanol but significantly more cost-effective (~1 USD per L vs. ~20 USD per L for imported HPLC-grade ethanol in Thailand), is currently used as a fuel additive for vehicles, including E20 and E85 blends.9
In developing an efficient HPLC method, optimizing separation conditions is a critical first step. Specifically, when ethanol is used as the mobile phase, several challenges must be considered. Its higher viscosity compared to methanol and acetonitrile can result in increased backpressure, while its slightly higher UV cutoff may affect detection sensitivity. Therefore, the optimization of these parameters not only ensured accurate and reliable results but also minimized technical issues, extended column lifespan, and achieved a good sensitivity.
To mitigate high backpressure which might occur, a shorter 10-cm C18 column was used un this work instead of conventional 15- or 25-cm columns. This choice reduced flow resistance by shortening the distance the mobile phase travels, thereby lowering backpressure.35,36 Following column selection, key chromatographic parameters—including mobile phase composition, flow rate, column temperature, and detection wavelength—were systematically optimized. The goal was to achieve a resolution of at least 2 between CTP and CDS, retention times within 5 minutes for both compounds, and a peak tailing factor below 1.5. In accordance with common maintenance guidelines for C18 columns, the method was designed to operate at a column temperature below 50°C while keeping backpressure below 200 bars. Consistent with green chemistry principles, the ethanol concentration was minimized as much as possible while still ensuring effective separation.
Initially, the optimal ethanol-to-water ratio in the mobile phase was investigated by maintaining a column temperature of 40°C and a flow rate of 1 mL/min. A small amount of phosphoric acid (0.05 mL per 100 mL of mobile phase) was added to maintain an acidic condition. At this low pH, sulfhydryl groups remain in their protonated (RSH) form, which is less nucleophilic and less prone to oxidation, thereby preventing disulfide bond formation. As shown in Table 1 and Figure 2a, increasing the ethanol content accelerated the elution of CTP and CDS but reduced their resolution. While the 35:65 ethanol-to-water ratio provided faster analysis than 30:70 with sufficient resolution, further increasing the ethanol content lowered the resolution below 2 and eventually resulted in an unresolved peak. Therefore, the 35:65 ratio was selected for the assay.
Table 1.
Effect of ethanol-to-water ratio in the mobile phase, flow rate, and column temperature on the chromatographic parameters
|
Parameter
|
CTP
|
CDS
|
Resolution between CTP and CDS
|
Backpressure
(bar)
|
|
Retention time (min)
|
Plate number
|
USP tailing
|
Retention time (min)
|
Plate number
|
USP tailing
|
| Ethanol: water ratio (v:v) |
| 30:70 |
2.42 |
891 |
0.85 |
4.98 |
778 |
0.85 |
4.91 |
102 |
| 35:65 |
2.08 |
1042 |
0.88 |
3.25 |
785 |
0.96 |
3.25 |
107 |
| 40:60 |
1.82 |
1057 |
0.89 |
2.32 |
667 |
1.02 |
1.69 |
115 |
| Flow rate (mL/min) |
| 1.0 |
2.08 |
1042 |
0.88 |
3.26 |
785 |
0.96 |
3.25 |
107 |
| 1.5 |
1.34 |
871 |
0.89 |
2.09 |
681 |
0.99 |
3.01 |
164 |
| 2.0 |
0.99 |
737 |
0.89 |
1.55 |
604 |
1.06 |
2.82 |
219 |
| Temperature (°C) |
| 30 |
1.39 |
1011 |
0.96 |
2.35 |
562 |
1.40 |
3.37 |
205 |
| 40 |
1.30 |
1278 |
1.03 |
2.04 |
882 |
1.16 |
3.52 |
164 |
| 50 |
1.25 |
1088 |
1.07 |
1.83 |
1292 |
1.03 |
3.51 |
134 |
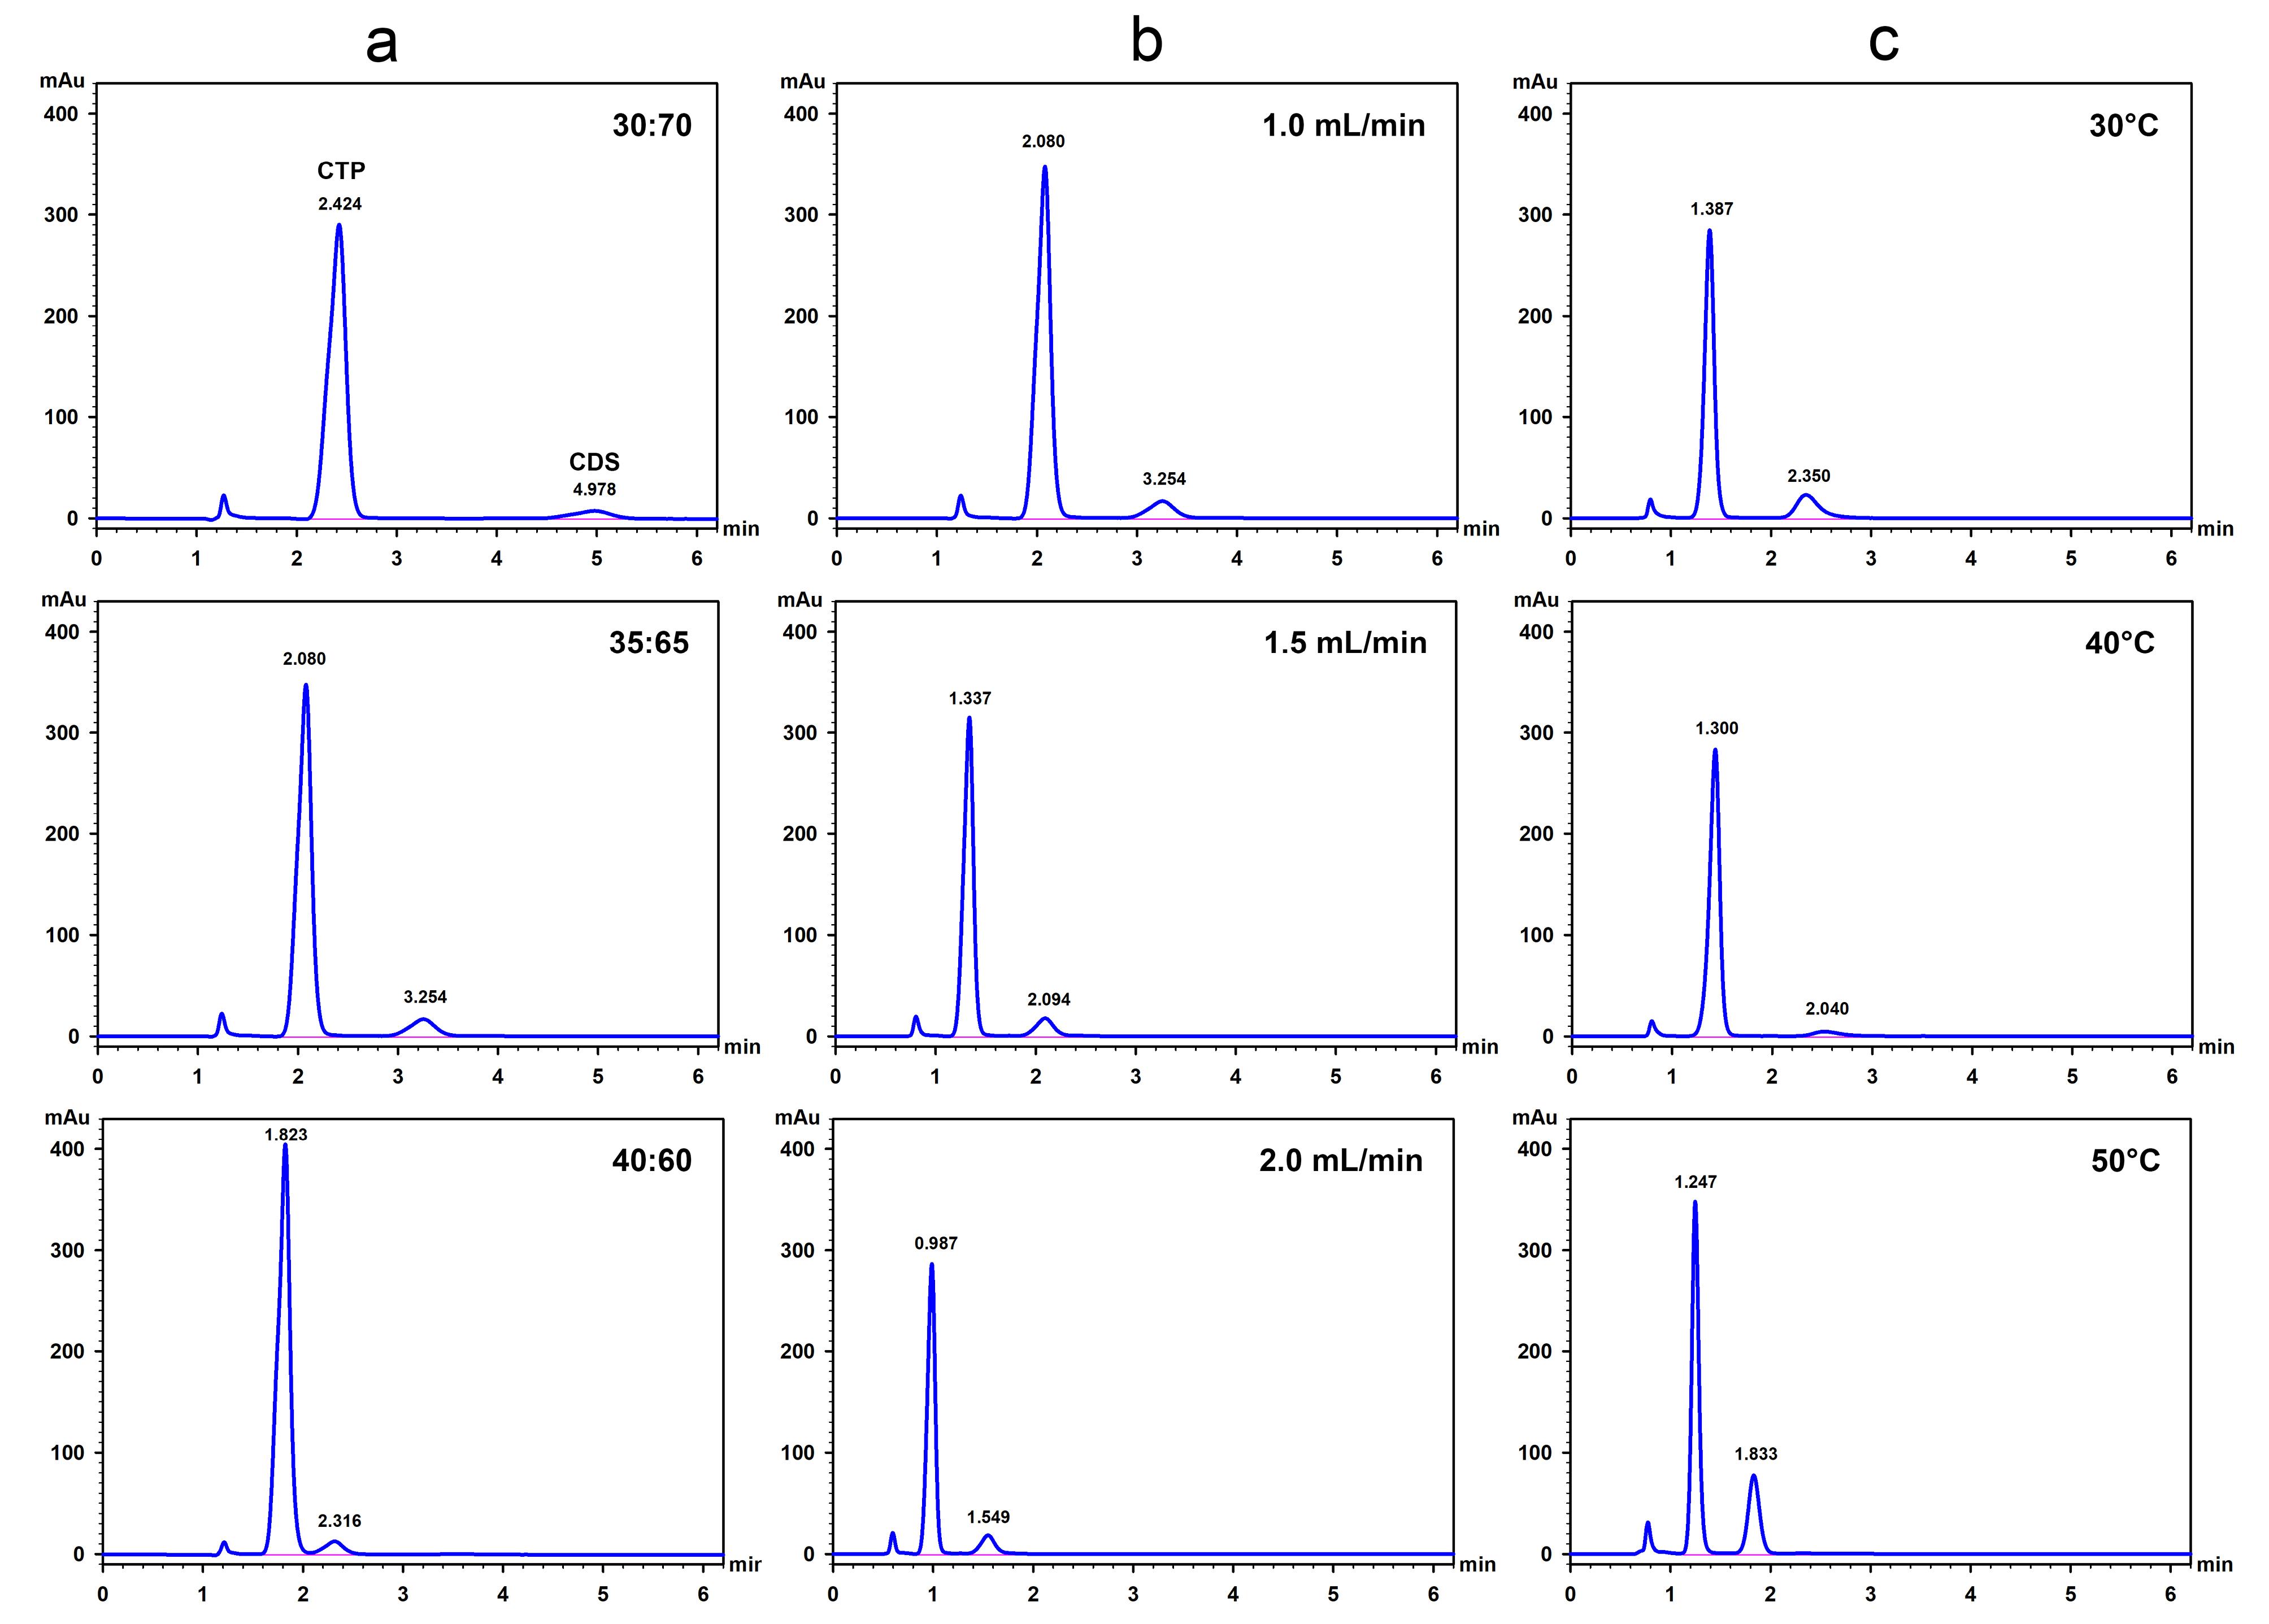
Figure 2.
Effects of ethanol-to-water ratio (a), flow rate (b), and column temperature (c) on the chromatographic separation of CTP (largest peak) and CDS (last peak). (a) Ethanol-to-water ratio was varied while maintaining a flow rate of 1.0 mL/min and a column temperature of 40 °C. (b) Flow rate was varied using a mobile phase of 35:65 ethanol-to-water and a column temperature of 40 °C. (c) Column temperature was varied using a 35:65 ethanol-to-water mobile phase and a flow rate of 1.5 mL/min
.
Effects of ethanol-to-water ratio (a), flow rate (b), and column temperature (c) on the chromatographic separation of CTP (largest peak) and CDS (last peak). (a) Ethanol-to-water ratio was varied while maintaining a flow rate of 1.0 mL/min and a column temperature of 40 °C. (b) Flow rate was varied using a mobile phase of 35:65 ethanol-to-water and a column temperature of 40 °C. (c) Column temperature was varied using a 35:65 ethanol-to-water mobile phase and a flow rate of 1.5 mL/min
To further reduce analysis time without exceeding the backpressure limit, the flow rate was optimized using a mobile phase with a 35:65 ethanol-to-water ratio and a column temperature of 40 °C. The results showed that increasing the flow rate from 1.0 to 1.5 mL/min allowed both compounds to be eluted within approximately 2 min (Table 1 and Figure 2b). Although a flow rate of 2.0 mL/min provided faster separation and acceptable resolution, it generated high backpressure exceeding 200 bars, which could shorten the column lifespan. Therefore, a flow rate of 1.5 mL/min was selected.
Next, the optimal column temperature was investigated under the established conditions of 35:65 ethanol-to-water and a flow rate of 1.5 mL/min. The results indicated that increasing the temperature not only lowered backpressure but also accelerated elution. To achieve good separation, with both compounds being eluted within approximately 2 min and backpressure remaining below 200 bars, either 40 °C or 50 °C could be used (Table 1 and Figure 2c). In this study, a low temperature, i.e., 40 °C was chosen as the optimal temperature to prolong column lifespan. Under these optimal conditions, both CTP and CDS were eluted from the column within 2.5 min, markedly reducing the analysis time compared to the USP method (14 min). Although the resolution between the CTP and CDS peaks was lower than that achieved with the USP method, it remained acceptable and complied with the USP chromatographic system suitability criteria specified in the monograph of captopril tablet assay (not less than 2) (Figure 3). This improved efficiency enhances throughput and minimizes solvent consumption, making the method more suitable for routine analysis.
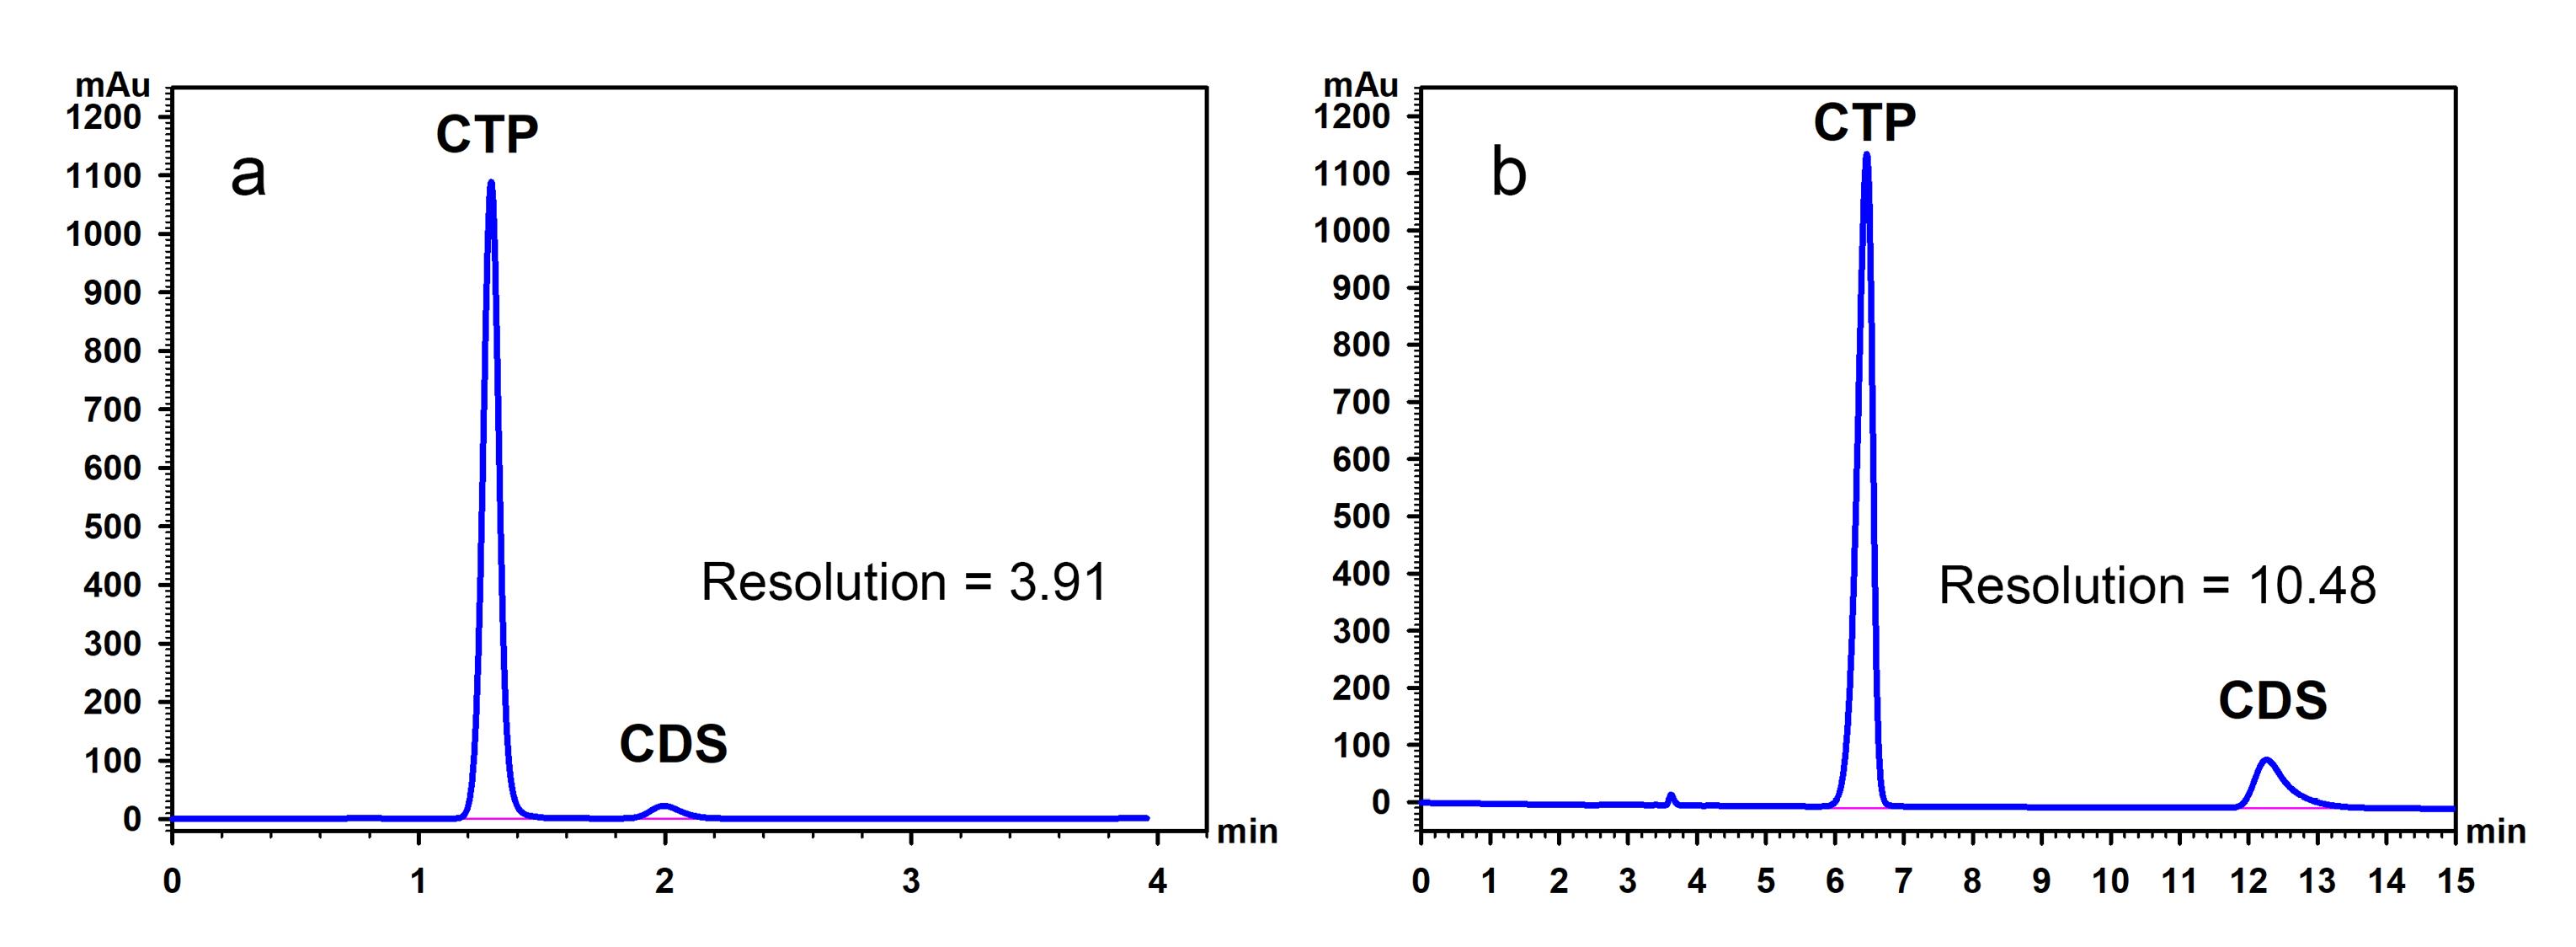
Figure 3.
Chromatograms of CTP and CDS obtained using (a) the proposed method and (b) the USP method. The proposed method utilized a mobile phase composed of ethanol, water, and phosphoric acid (35:65:0.05, v/v/v), a flow rate of 1.5 mL/min, and a 10 cm C18 column maintained at 40 °C. The USP method used a mobile phase consisting of methanol, water, and phosphoric acid (55:45:0.05, v/v/v), a flow rate of 1.0 mL/min, and a 25 cm C18 column maintained at 25 °C
.
Chromatograms of CTP and CDS obtained using (a) the proposed method and (b) the USP method. The proposed method utilized a mobile phase composed of ethanol, water, and phosphoric acid (35:65:0.05, v/v/v), a flow rate of 1.5 mL/min, and a 10 cm C18 column maintained at 40 °C. The USP method used a mobile phase consisting of methanol, water, and phosphoric acid (55:45:0.05, v/v/v), a flow rate of 1.0 mL/min, and a 25 cm C18 column maintained at 25 °C
In this study, the optimal detection wavelength was also investigated, and the results are presented in Table 2. Although lower wavelengths (210–220 nm) provided higher sensitivity for detecting CTP (0.25–1.25 mg/mL) and CDS (0.0125–0.0625 mg/mL), as indicated by the steeper slope of the regression equation, peak areas at high concentrations were excessive, leading to the reduced linearity (r2). In contrast, detection at 225 nm produced a standard curve with a better r2. Furthermore, the y-intercept was not significantly different from zero, meaning the line passed through the origin—unlike those obtained at other wavelengths. Therefore, despite the lower sensitivity, it remains sufficient for detection, with a wavelength of 225 nm selected for the analysis.
Table 2.
Effect of detection wavelength on regression equations, LOD and LOQ
|
Wavelength (nm)
|
CTP*
|
CDS**
|
Regression
equation
|
r2
|
LOD
|
LOQ
|
Regression
equation
|
r2
|
LOD
|
LOQ
|
| 225 |
y = 5071.16x + 146.75 |
0.9994 |
0.038 |
0.116 |
y = 6137.51x - 0.83 |
0.9999 |
0.0005 |
0.0014 |
| 220 |
y = 8111.38x + 736.34 |
0.9933 |
0.130 |
0.393 |
y = 10502.70x - 10.73 |
0.9999 |
0.0005 |
0.0014 |
| 215 |
y = 9546.55x + 2550.11 |
0.9638 |
0.306 |
0.927 |
y = 16900.69x - 16.48 |
0.9999 |
0.0005 |
0.0015 |
| 210 |
y = 9446.23x + 4645.93 |
0.9414 |
0.394 |
1.195 |
y = 23348.88x -22.31 |
0.9999 |
0.0005 |
0.0014 |
* CTP was studied over the concentration range of 0.25–1.25 mg/mL.
** CDS was studied over the concentration range of 0.0125–0.0625 mg/mL.
Method validation results
The validation of the HPLC assay for CTP and CDS demonstrated linearity, sensitivity, specificity, accuracy, precision, and robustness in accordance with USP and ICH guidelines. Linearity was demonstrated within the concentration ranges of 0.25–1.25 mg/mL for CTP and 0.0125–0.0625 mg/mL for CDS, with correlation coefficients (R2) of 0.9994 and 0.9999, respectively, confirming excellent linearity. The corresponding standard curves and regression equations are presented in Figure 4. For both analytes, the residual plots exhibited a random distribution, indicating the absence of systematic bias and supporting the linearity of the calibration models. Furthermore, the 95% confidence intervals for the y-intercepts (–39.89 to 333.39 for CTP and –3.61 to 1.95 for CDS) included zero, indicating that the intercepts were not statistically different from zero.
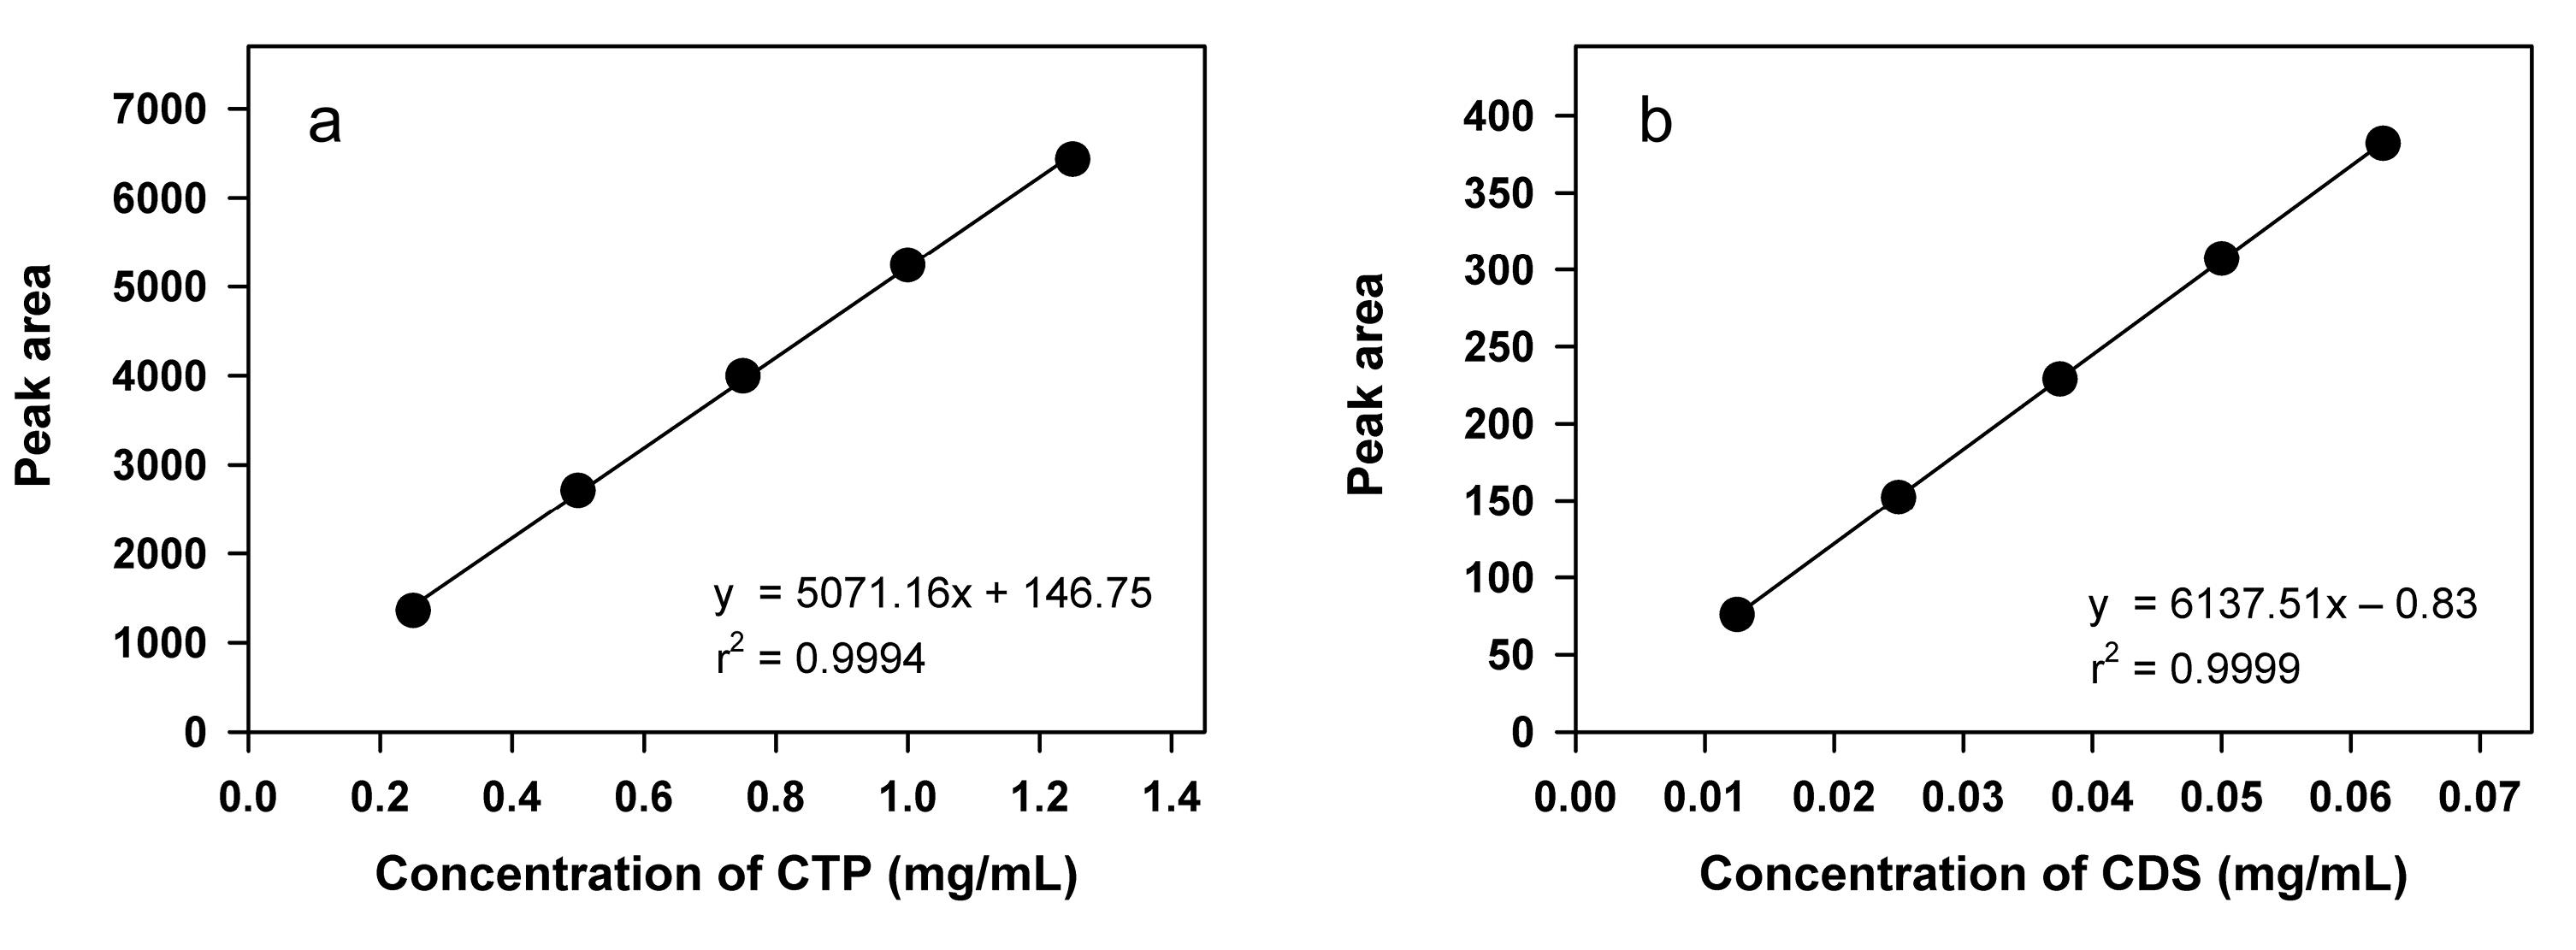
Figure 4.
Standard curves of CTP (a) and CDS (b)
.
Standard curves of CTP (a) and CDS (b)
Sensitivity was determined from the standard curves by calculating the LOD and LOQ. The LOD and LOQ values for CTP were 0.038 mg/mL and 0.116 mg/mL, respectively, while those for CDS were 0.0005 mg/mL and 0.014 mg/mL. These results confirmed the method’s capability to detect and quantify low levels of both analytes, particularly CDS, which is present as an impurity. The peaks of CTP and CDS were well separated, with no overlapping peaks from tablet excipients. Diode array detection further confirmed method specificity, as the peak purity for both CTP and CDS exceeded 990, surpassing the thresholds (Figure 5).
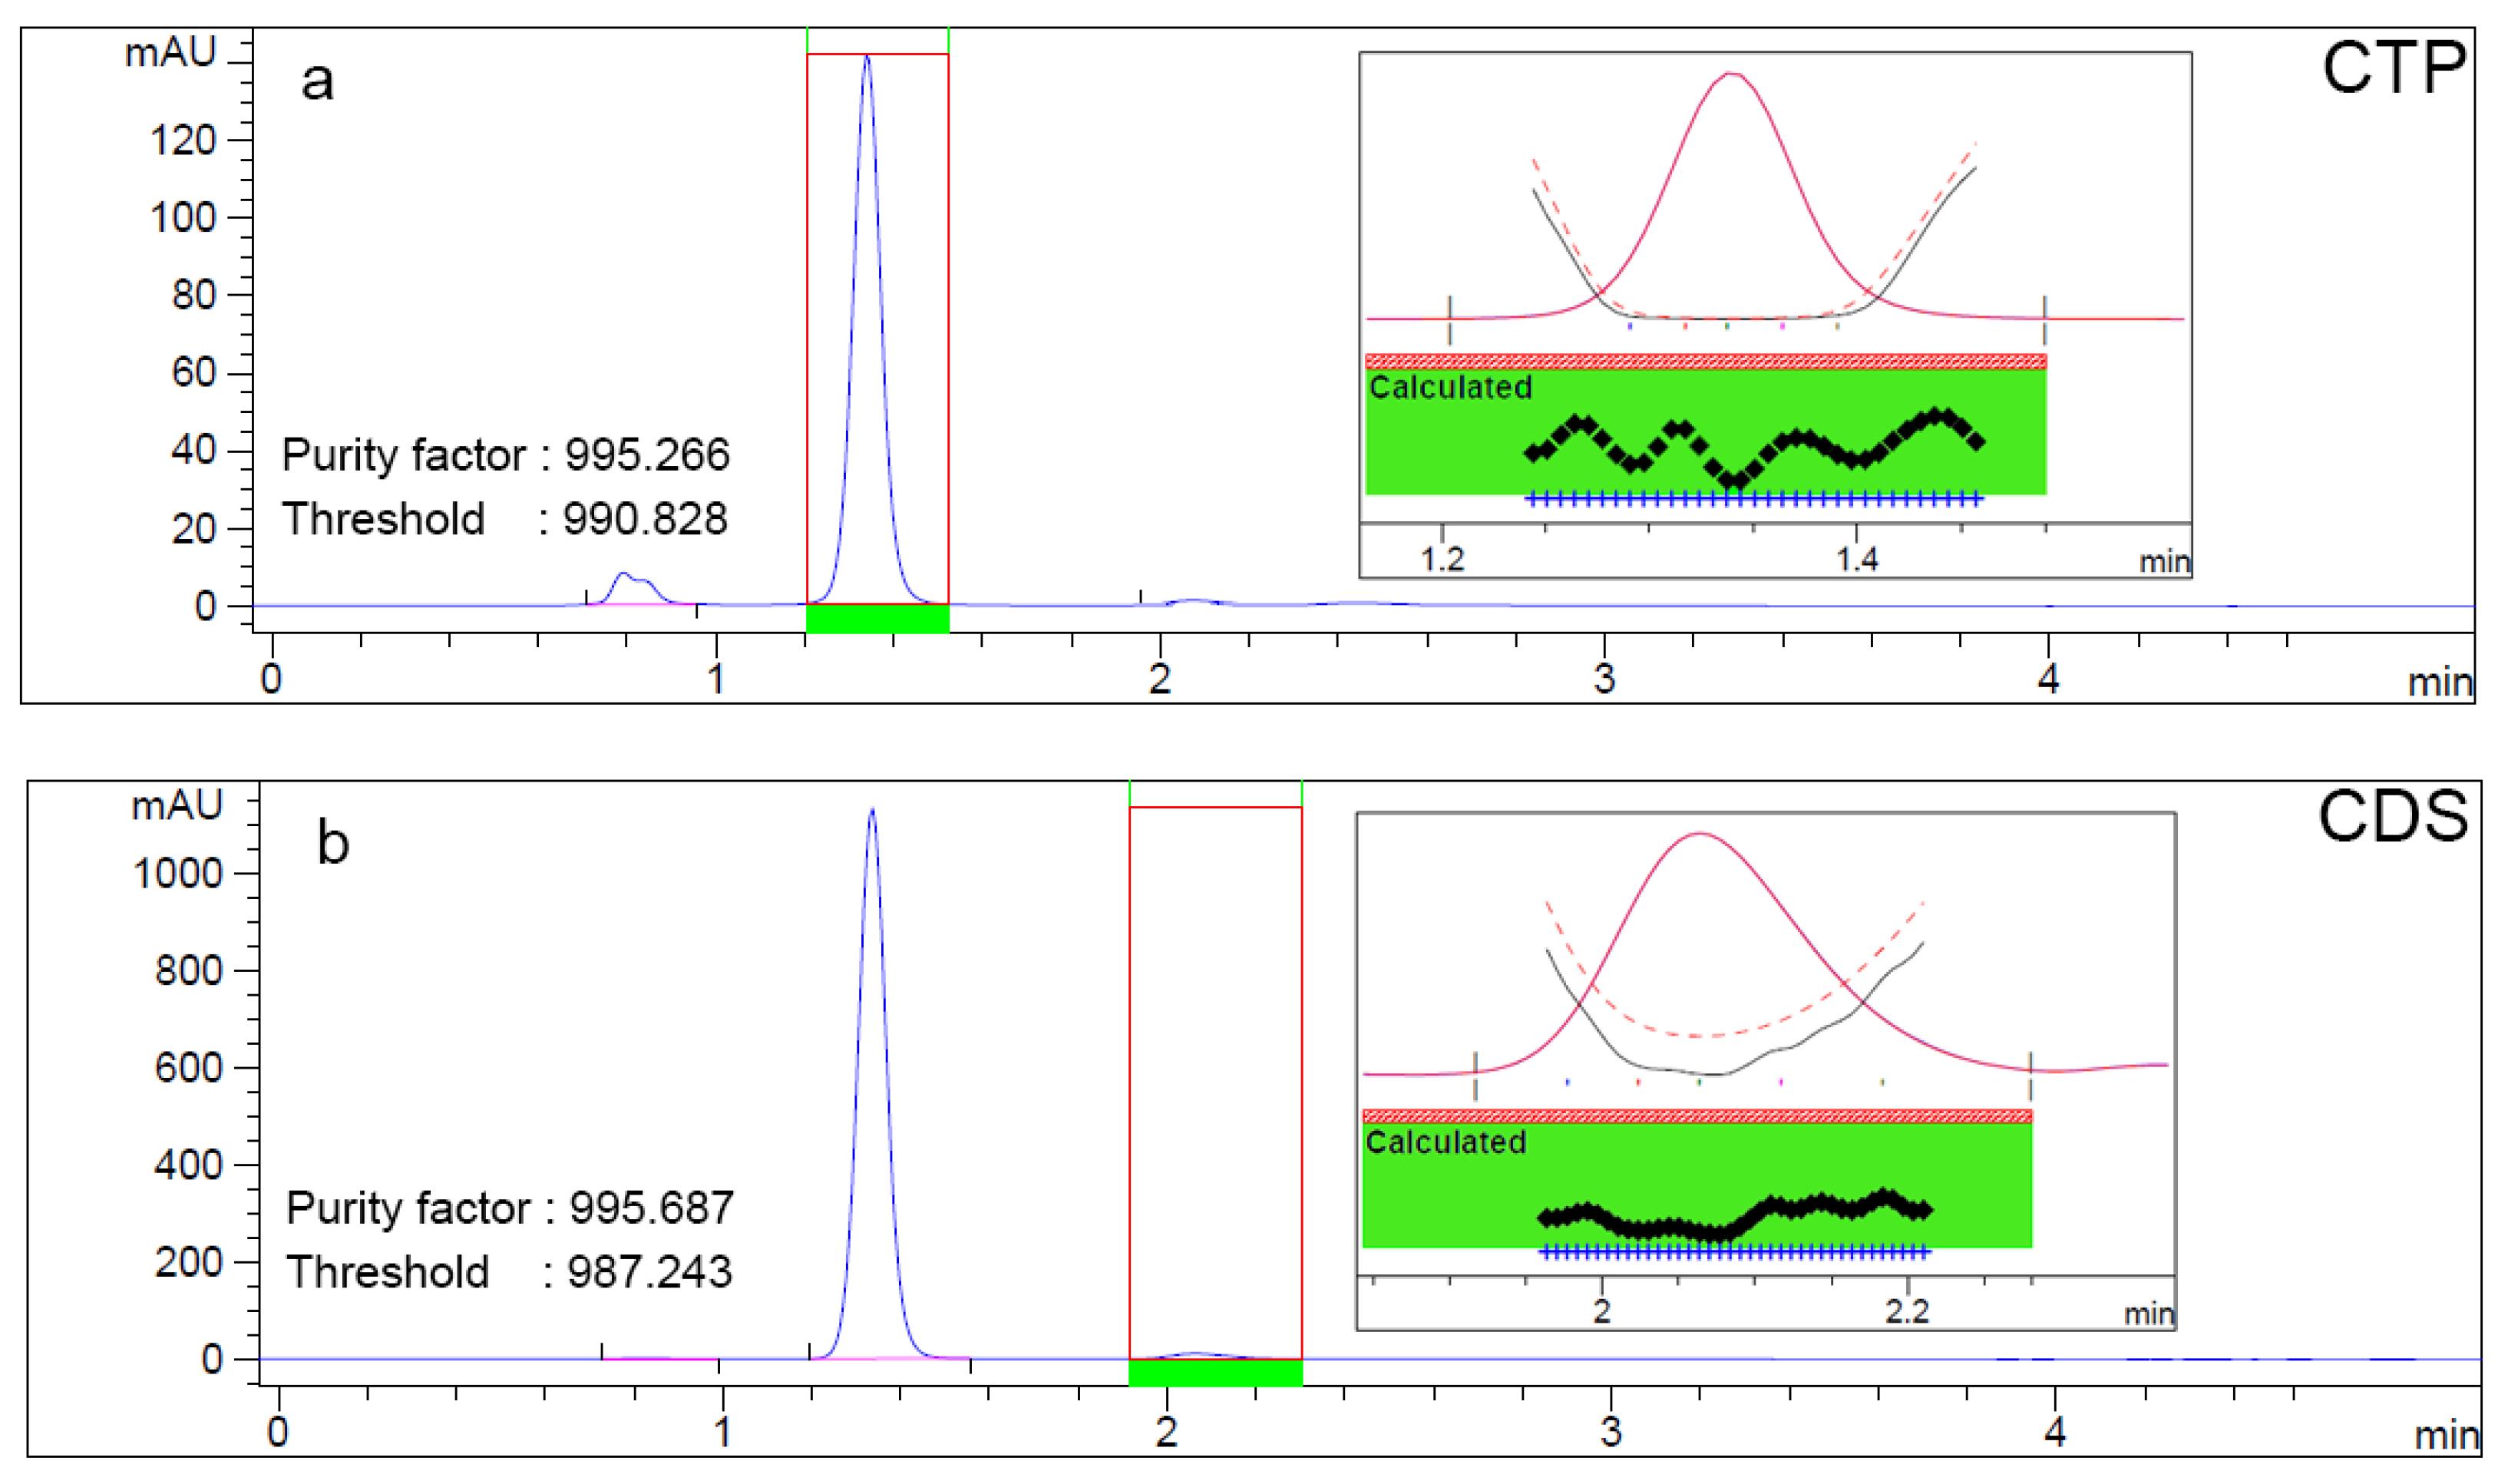
Figure 5.
Peak purity of CTP (a) and CDS (b), evaluated using diode array detector
.
Peak purity of CTP (a) and CDS (b), evaluated using diode array detector
The accuracy was assessed through recovery studies at three concentration levels (80%, 100%, and 120% of target concentrations). The recovery values at each level, as well as the means for CTP and CDS, were within 98.0% to 102.0% (Table 3), demonstrating accurate quantification. Precision was evaluated in terms of intra-day and inter-day variations, with all % RSD values meeting the acceptance criteria, indicating high reproducibility.
Table 3.
Accuracy and precision of the proposed method
|
Parameter
|
Result
|
|
CTP
|
CDS
|
| Accuracy |
|
|
| % Recovery (n = 3, for each level) |
100.39 ± 1.24% (low; spiked with 0.8 mg/mL) |
100.59 ± 0.84% (low; spiked with 0.015 mg/mL) |
|
|
99.97 ± 1.21% (medium; spiked with 1.0 mg/mL)
98.22 ± 0.05% (high; spiked with 1.2 mg/mL) |
99.42 ± 0.82% (medium; spiked with 0.030 mg/mL)
100.09 ± 1.21% (high; spiked with 0.045 mg/mL) |
| Precision |
|
|
| %RSD for intra-day precision (n = 6) |
0.34% |
1.24% |
| %RSD for inter-day precision (n = 18) |
1.03% |
3.56% |
Robustness was assessed by introducing minor variations in chromatographic conditions, including mobile phase composition, detection wavelength, flow rate, and column temperature. No significant changes in method performance were observed, as indicated by % RSD values of the assay results, i.e., % labeled amount or % (w/w) of CDS per CTP, below 2% for both analytes (Table 4). These findings confirm that the method is robust for routine analysis. Overall, the validation results demonstrate that the developed HPLC method is suitable for the accurate and reliable quantification of CTP and its impurity CDS in tablet formulations.
Table 4.
Robustness of the proposed method (n = 3)
|
Parameter
|
% RSD of % labeled amount of CTP
|
% RSD of % (w/w) of CDS per CTP
|
| Ethanol:water ratio (v:v) |
|
|
| 33:67 |
0.93 |
1.27 |
| 35:65 |
| 37:63 |
| Wavelength (nm) |
|
|
| 222 |
1.12 |
1.73 |
| 225 |
| 228 |
| Flow rate (mL/min) |
|
|
| 1.3 |
0.80 |
0.68 |
| 1.5 |
| 1.7 |
| Temperature (°C) |
|
|
| 37 |
0.61 |
0.74 |
| 40 |
| 43 |
The stability of CTP standard solutions and tablet sample solutions (n = 3, for each) was assessed over an 8-h period. For the CTP standard solution, the remaining concentration of CTP was 99.8 ± 0.1%, while CDS showed a slight increase to 101.3 ± 0.4% after 8 h. Similarly, the tablet sample solution exhibited 99.2 ± 0.3% of the remaining CTP, with CDS increasing to 101.6 ± 0.3%. These results indicate that both solutions remained stable within the studied period, with only minor variations in CDS levels, likely due to oxidative processes.
Application of the proposed method to the analysis of real samples
The proposed method was applied to the analysis of commercial tablet samples and compared with the standard USP method.23 Since the regression analysis of the standard curve for both analytes showed a y-intercept that was not significantly different from zero, it indicated the feasibility of using a single-point calibration method which requires only one standard solution, thus reducing the time, reagent consumption, and effort needed for preparation and measurement. This approach was therefore evaluated for assay calculations alongside the multiple-point calibration method (standard curve). As summarized in Table 5, the assay results, expressed as % labeled amount of CTP and % (w/w) of CDS per CTP, showed no statistically significant difference between the single-point calibration and the standard curve method. Furthermore, the proposed method yields results consistent with the USP method. Therefore, regardless of whether calibration is based on a single point or multiple points, the proposed method is effective and reliable alternative to the USP method for the analysis of CTP and CDS in tablets.
Table 5.
Assay results for commercial tablets obtained using the proposed method and the USP method (n = 6)
|
Result
|
Proposed method
|
USP method
|
|
Multiple-point calibration (standard curve)
|
One-point calibration
|
| % Labeled amount of CTP |
94.69 ± 0.34a |
93.80 ± 1.44a |
94.58 ± 1.26a |
| % (w/w) of CDS |
1.95 ± 0.04b |
1.93 ± 0.02b |
1.98 ± 0.06b |
a No significant difference tested by ANOVA at 95% confidence level; Fcal (1.162) < Fcrit (3.682).
b No significant difference tested by ANOVA at 95% confidence level; Fcal (2.568) < Fcrit (3.682).
Table 6 presents a comparison of the analytical figures of merit for the proposed assay, the pharmacopeial method, and previously reported HPLC methods used for quantifying CTP and CDS in pharmaceutical formulations. Although the LOD and LOQ of the proposed method are occasionally higher than those reported in certain studies, they are adequate for the analysis of CTP and CDS in tablet dosage forms. Notably, this method offers the shortest run time for the simultaneous determination of both compounds and employs the greenest mobile phase, completely free of methanol and acetonitrile. This feature also marks the proposed method as the first ethanol-based HPLC assay for CTP. Furthermore, it avoids the need for pre-column derivatization with costly reagents such as Pd(II), as required by some earlier methods. Owing to its simplicity, efficiency, and use of environmentally friendly reagents, the method is highly suitable for routine drug quality control and holds promise for future adaptation to more complex matrices, including biological samples.
Table 6.
Comparison of analytical figures of merit for selected HPLC methods used to quantify captopril (CTP) and captopril disulfide (CDS) in pharmaceutical formulations
|
Method
|
Sample type
|
Mobile phase composition
|
Linear range
|
LOD (μg/mL)
|
LOQ (μg/mL)
|
Run time (min)
|
Key advantages / limitations
|
| Proposed method |
Tablets |
Bioethanol:water:phosphoric acid (35:65:0.05, v/v/v) |
CTP: 0.25-1.25 mg/mL
CDS: 0.0125-0.0625 mg/mL |
CTP: 0.038
CDS: 0.0005 |
CTP: 0.116
CDS: 0.014 |
2.5 |
Simultaneous CTP & CDS quantification
Fastest analysis time
Green mobile phase |
| USP method23 |
Tablets |
Methanol:water:phosphoric acid (55:45:0.05, v/v/v) |
Single point calibration:
CTP: 1.0 mg/mL
CDS: 0.05 mg/mL |
Not reported |
Not reported |
14 |
Official compendial method
Use of methanol in the mobile phase
Longer run time |
| Mirza et al37 |
Tablets |
Potassium phthalate buffer:methanol:water (2.5:15:82.5, v/v/v) |
CTP: 0.20-2.00 mg/mL |
Not reported |
CTP: 0.7 ng |
50 |
Use methanol in the mobile phase
Extremely long run time
High solvent consumption |
| Pebriana et al21 |
Mucoadhesive tablets |
Methanol:water:phosphoric acid (50:50:0.005, v/v/v) |
CTP: 35-65 ppm |
Not reported |
Not reported |
8.5 |
Moderate run time
Use of methanol in the mobile phase |
| Ahmed et al38 |
Tablets |
0.025% w/v Pd(II) chloride in acetonitrile:methanol:water with 10 mM Briton Robinson buffer (pH 4) and 0.25 M KCl (10:40:50, v/v/v) |
CTP: 2-32 μg/mL |
CTP: 0.18 |
CTP: 0.6 |
7.5 |
Reasonable run time
Use of expensive Pd(II) reagent and acetonitrile in the mobile phase |
| Leanpolchareanchai et al39 |
Liquid extemporaneous preparations |
Methanol:water:phosphoric acid (47:53:0.1, v/v/v) |
CTP: 0.75-20 μg/mL |
CTP: Not reported
CDS: 0.07 |
Not reported |
15 |
Validated for liquid formulations
Longer run time
Use of methanol in the mobile phase |
Efficiency of the proposed laboratory waste treatment
Although CTP is not classified as highly hazardous, it is a pharmaceutical pollutant present in the environment and has been reported to cause toxic effects in certain organisms, such as fish. Additionally, it is susceptible to oxidation, which leads to the formation of CDS. This transformation increases lipophilicity, which may facilitate bioaccumulation in aquatic and terrestrial organisms. Furthermore, CDS exhibits greater environmental persistence than its parent compound, particularly in low-oxygen conditions, where oxidative degradation is limited.40 Given the scarcity of toxicological data on CDS, its potential ecological impact cannot be excluded. Therefore, effective waste management strategies—beyond standard good laboratory practices—are essential to ensure the complete removal of CTP and to prevent CDS formation, thereby minimizing the risk of uncontrolled environmental exposure.
To address this environmental concern of pharmaceutical contamination, activated carbon was chosen in this work as an adsorbent for the removal of pharmaceutical residues from analytical waste prior to disposal. This selection was guided by the previous study demonstrating the efficacy of activated carbon derived from Butia catarinensis for similar application.16 However, given the abundant availability of coconut shells as agricultural waste in Thailand, activated carbon produced from this material was chosen as a locally sourced and sustainable alternative.
Equilibrium isotherm studies were initially performed using 0.025 g of activated carbon and CTP—the major component in the waste liquid—with initial concentrations ranging from 750 to 2500 mg/L. The results demonstrated that coconut shell-derived activated carbon exhibited good adsorption performance for CTP removal. The experimental data fitted well to the Langmuir isotherm model with a high correlation coefficient (R2 = 0.9896), indicating monolayer adsorption behavior. The maximum adsorption capacity (Qmax) was determined to be 3044 mg CTP/g carbon at 25 °C.
To further study the practical application for waste treatment, batch adsorption experiments were conducted on pooled laboratory waste liquid containing approximately 1 mg/mL CTP, varying the activated carbon-to-waste liquid ratios and shaking times. As shown in Figure 6a, a high removal efficiency—where over 99% of CTP was effectively adsorbed—was achieved through two approaches: either using a lower adsorbent-to-waste liquid ratio with a longer shaking time (e.g., 1:50 (g/mL) for 45 min) or a higher ratio with a shorter shaking time (e.g., 1:10 (g/mL) for 5 min or 1:20 (g/mL) for 15 min). However, prolonged shaking times were found to potentially promote CDS generation, as illustrated in Figure 6b. To mitigate this issue, a rapid treatment strategy that minimizes CTP oxidation while also reducing electricity consumption is preferable. For instance, employing an adsorbent-to-waste liquid ratio of 1:10 for 5 min or 1:20 for 15 min limited CDS formation to less than 1%, calculated based on the stoichiometric conversion of 2 moles of CTP to 1 mole of CDS. Although this approach requires a higher adsorbent dosage, it remains cost-effective by utilizing locally sourced coconut shell-derived activated carbon, which is available at approximately 2 USD/kg. This makes it a financially viable and environmentally sustainable solution for CTP waste treatment. From these findings, the proposed laboratory waste treatment method is practical, rapid, and affordable, offering an efficient approach to minimizing the environmental impact of CTP disposal. In other locations, alternative sorbents that are locally available, easily obtainable, and affordable may be evaluated for their adsorption performance and utilized accordingly for waste treatment.
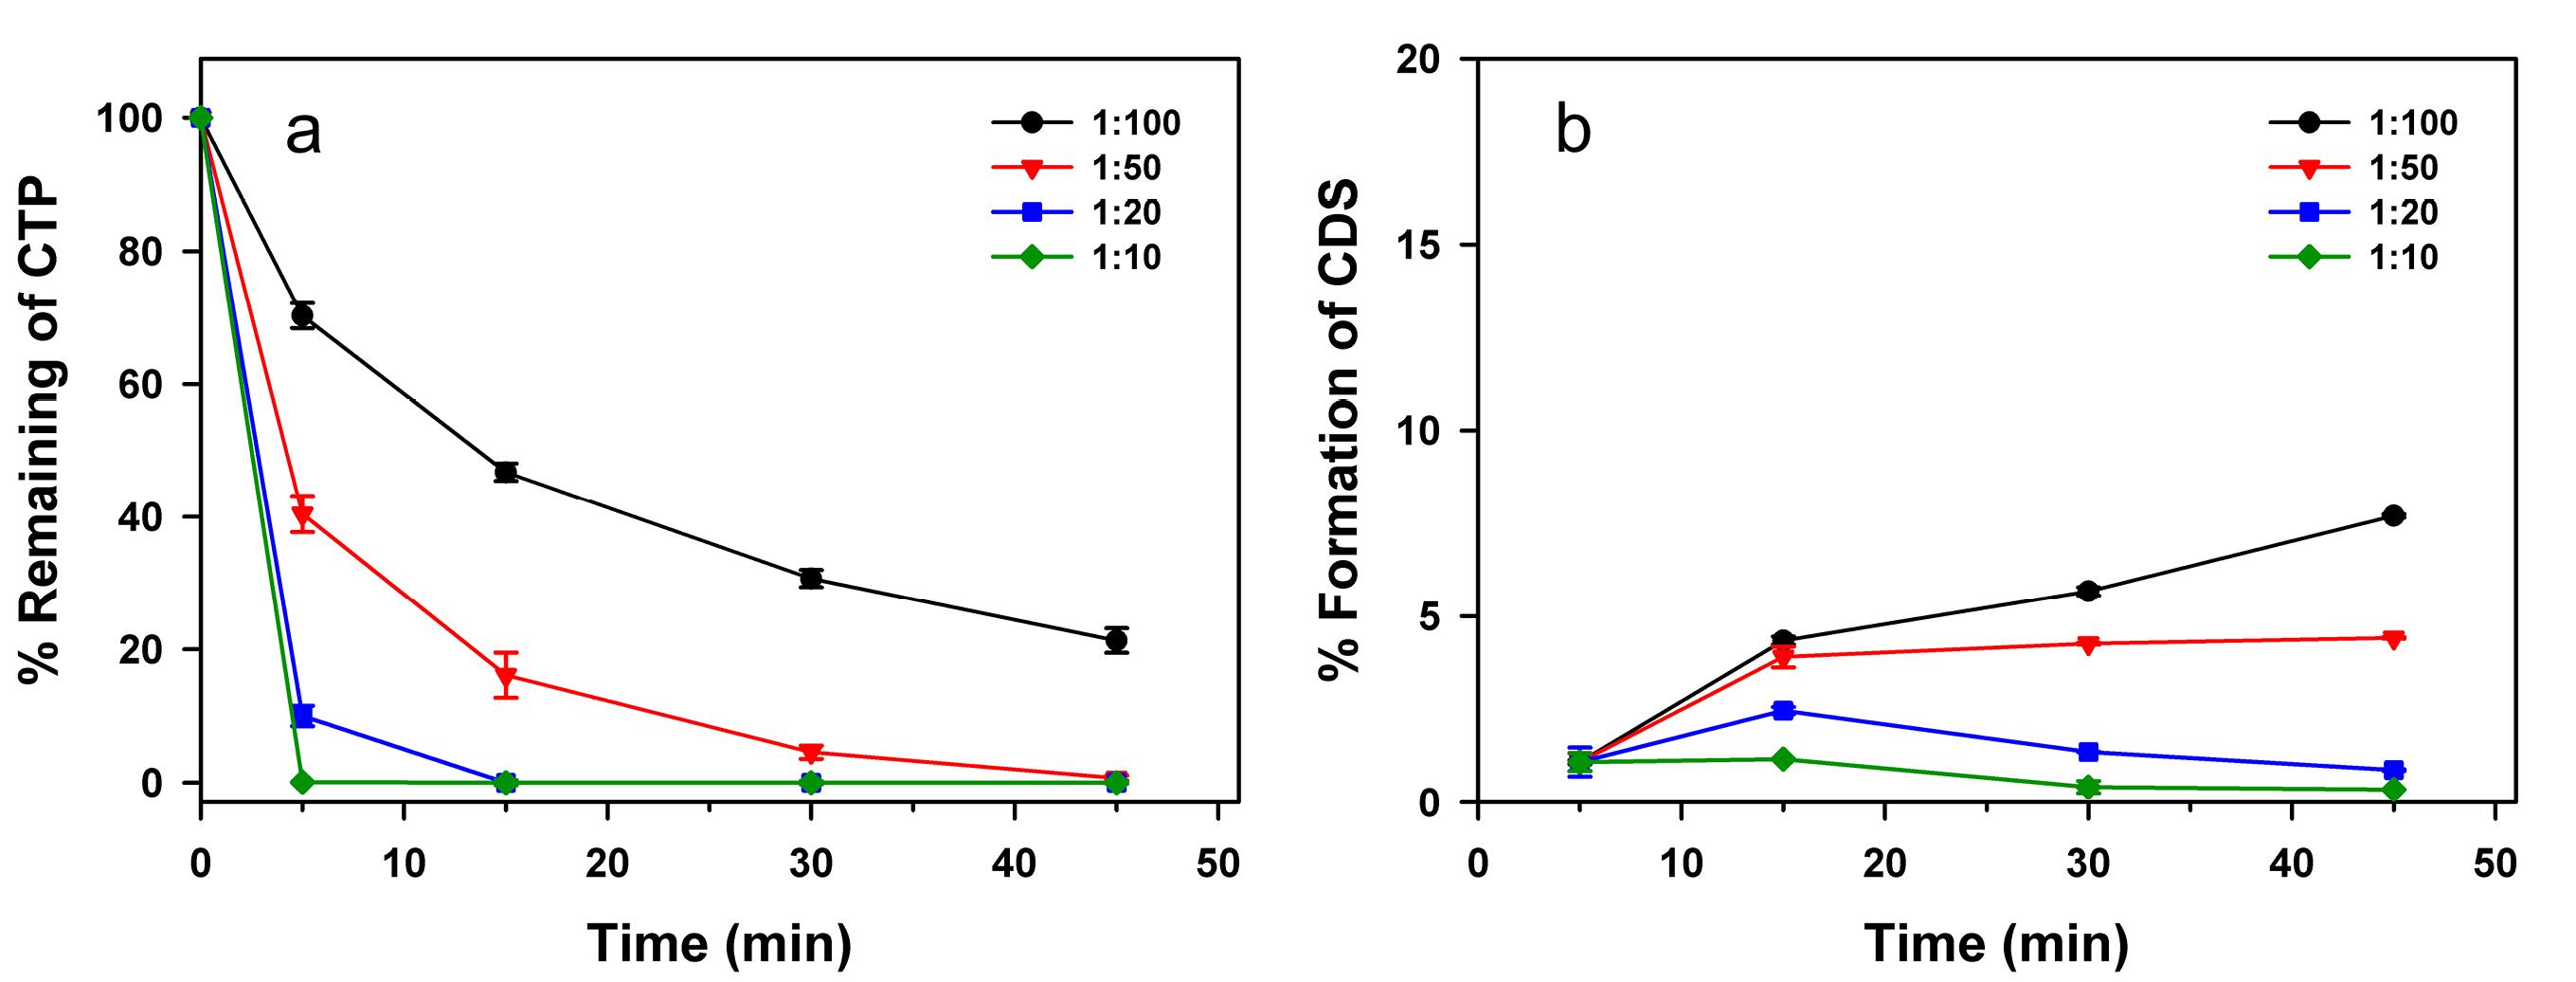
Figure 6.
Percentage of remaining CTP (a) and percentage of CDS formation (b) as functions of shaking time, evaluated at different adsorbent-to-waste liquid ratio (g/mL)
.
Percentage of remaining CTP (a) and percentage of CDS formation (b) as functions of shaking time, evaluated at different adsorbent-to-waste liquid ratio (g/mL)
Greenness, practicality and alignment with sustainable development goals of the analytical process
The results of the greenness evaluation of the ethanol-based HPLC method are presented in Table 7. The AGREE assessment yielded a score of 0.63 for the proposed method, which was higher than that of the USP method (0.56). This improvement was primarily attributed to the greater analytical throughput (about 20 and 4 samples per hour for the proposed and USP methods, respectively) and the use of ethanol, a renewable solvent, instead of methanol. Similarly, the GAPI analysis indicated a greener profile for the proposed method, as evidenced by fewer red sections. This was due to the utilization of greener solvent, i.e. ethanol, lower waste generation, and the integration of waste treatment into the analytical workflow. In terms of practicality, as evaluated by the BAGI tool, the proposed method also achieved a higher score than the USP method, primarily due to its greater analytical throughput. Overall, these findings demonstrate that the proposed HPLC assay, which enables the simultaneous analysis of CTP and CDS using bioethanol as a mobile phase, along with waste treatment procedures, is both environmentally friendly and practical.
Table 7.
Greenness and practicality and applicability of the proposed method and USP methods assessed by Analytical GREEnness (AGREE), Green Analytical Procedure Index (GAPI) and Blue Applicability Grade Index (BAGI)
|
Assessment of greenness
|
Proposed method
|
USP method
|
| AGREE* |
|
|
| GAPI |
|
|
| BAGI |
|
|
* 1 = Sample treatment, 2 = Sample amount, 3 = Device positioning, 4 = Sample preparation Stages, 5 = Automation, miniaturization, 6 = Derivatization, 7 = Waste, 8 = Analysis throughput, 9 = Energy consumption, 10 = Source of reagents, 11 = Toxicity, 12 = Operator’s safety.
Beyond green chemistry, sustainability is a broader concept that encompasses three key pillars: environmental, economic, and social sustainability. While green chemistry primarily focuses on minimizing environmental impact, achieving a truly sustainable future requires a holistic approach that balances all three dimensions. In alignment with the United Nations Sustainable Development Goals (SDGs)—which aim to reduce environmental harm, foster economic growth, and ensure social equity41 —the proposed analytical workflow strongly supports these global objectives. Designed to ensure the quality, efficacy, and safety of pharmaceutical products, this analytical method directly contributes to SDG #3 (Good Health and Well-Being). The adoption of ethanol as a safer alternative to hazardous solvents, coupled with an integrated laboratory waste treatment system, aligns with SDG #12 (Responsible Consumption and Production) by reducing environmental impact. Furthermore, these efforts help safeguard aquatic and terrestrial ecosystems, supporting SDG #14 (Life Below Water) and SDG #15 (Life on Land).
Another key sustainability aspect of this work is the use of locally sourced agro-waste-derived materials, including bioethanol from sugarcane molasses and activated carbon from coconut shell waste. By converting agricultural byproducts into value-added materials, this approach enhances resource efficiency, reduces reliance on imports, and minimizes waste and pollution. It also strengthens local economies, self-reliance, and job creation, aligning with SDG #8 (Decent Work and Economic Growth). Overall, this work demonstrates a commitment to sustainability by integrating eco-friendly innovations into pharmaceutical analysis, promoting responsible practices, and contributing to a more resilient and sustainable industry.
Conclusion
This study demonstrates a green and sustainable HPLC approach for captopril analysis by seamlessly integrating locally sourced agro-waste-derived materials into both the analytical method and waste management. By replacing petrochemical solvents with bioethanol derived from sugarcane molasses, the method enhances environmental safety, resource efficiency, and the overall sustainability of the process while maintaining analytical performance. Additionally, activated carbon from coconut shell waste effectively removes pharmaceutical residues, minimizing environmental contamination. The use of a short column further reduces analysis time and increases throughput, leading to time and energy savings, as well as a reduction in waste generation. This integrated strategy reduces reliance on non-renewable resources, aligns with green chemistry principles, and supports a circular economy. It also strengthens local economies and promotes job creation, amplifying its broader sustainability impact. By utilizing renewable resources and implementing effective waste management, this study sets a precedent for more sustainable pharmaceutical analysis. It highlights the potential of agricultural waste valorization in advancing eco-friendly innovations. Ultimately, this work provides a scalable and impactful solution for reducing the environmental footprint of pharmaceutical testing while fostering responsible resource utilization.
Competing Interests
The authors declare that there is no conflict of interest.
Declaration of Generative AI and AI-Assisted Technologies in the Writing Process
During the preparation of this work, the authors used ChatGPT in order to assist with language refinement, improve writing clarity, and enhance the overall quality of the manuscript. After using this tool, the authors reviewed and edited the content as needed and take full responsibility for the content of the publication.
References
- Dogan A, Eylem CC, Basci Akduman NE. Application of green methodology to pharmaceutical analysis using eco-friendly ethanol-water mobile phases. Microchem J 2020; 157:104895. doi: 10.1016/j.microc.2020.104895 [Crossref] [ Google Scholar]
- Kalisz O, Hulicka G, Tobiszewski M, Bocian S. Performance evaluation of green and conventional solvents in reversed-phase liquid chromatography based on the separation of non-polar and polar substances. Green Chem 2025; 27(11):3020-31. doi: 10.1039/d4gc05737f [Crossref] [ Google Scholar]
- Ogden PB, Dorsey JG. Reversed phase HPLC with high temperature ethanol/water mobile phases as a green alternative method for the estimation of octanol/water partition coefficients. J Chromatogr A 2019; 1601:243-54. doi: 10.1016/j.chroma.2019.05.002 [Crossref] [ Google Scholar]
- Yabré M, Ferey L, Somé IT, Gaudin K. Greening reversed-phase liquid chromatography methods using alternative solvents for pharmaceutical analysis. Molecules 2018; 23(5):1065. doi: 10.3390/molecules23051065 [Crossref] [ Google Scholar]
- Duarte LO, Ferreira B, Silva GR, Ipólito AJ, de Oliveira MF. Validated green phenyl reversed-phase LC method using ethanol to determine MDMA in seized ecstasy tablets. J Liq Chromatogr Relat Technol 2020; 43(17-18):761-9. doi: 10.1080/10826076.2020.1811725 [Crossref] [ Google Scholar]
- Haq N, Shakeel F, Alanazi F, Alshora DH, Ibrahim MA. Development and validation of a green RP-HPLC method for the analysis of rosuvastatin: a step towards making liquid chromatography environmentally benign. Green Process Synth 2018; 7(2):160-9. doi: 10.1515/gps-2017-0023 [Crossref] [ Google Scholar]
- Medhat PM, Fouad MM, Monir HH, Ghoniem NS. A sustainable and green HPLC-PDA technique for the simultaneous estimation of Post-COVID-19 syndrome co-administered drugs with greenness and whiteness assessment. Sci Rep 2024; 14(1):26222. doi: 10.1038/s41598-024-75216-4 [Crossref] [ Google Scholar]
- Nabil N, Sedik GA, Zaazaa HE, El-Mosallamy SS. Innovative green stability-indicating HPLC method coupled with fluorescence detection for determination of antidiabetic agent canagliflozin. Talanta Open 2025; 11:100436. doi: 10.1016/j.talo.2025.100436 [Crossref] [ Google Scholar]
- Thanayutsiri T, Mantadilok S, Sapsin J, Tungwattanaviboon T, Wongwatanasin J, Opanasopit P. Development of a green and rapid ethanol-based HPLC assay for aspirin tablets and feasibility evaluation of domestically produced bioethanol in Thailand as a sustainable mobile phase. Green Process Synth 2025; 14(1):20240200. doi: 10.1515/gps-2024-0200 [Crossref] [ Google Scholar]
- Vieira-Sellaï L, Quintana M, Diop O, Mercier O, Tarrit S, Raimi N. Green HPLC quantification method of lamivudine, zidovudine and nevirapine with identification of related substances in tablets. Green Chem Lett Rev 2022; 15(3):695-704. doi: 10.1080/17518253.2022.2129463 [Crossref] [ Google Scholar]
- Adedipe DT, Chen C, Lai RWS, Xu S, Luo Q, Zhou GJ. Occurrence and potential risks of pharmaceutical contamination in global estuaries: a critical review and analysis. Environ Int 2024; 192:109031. doi: 10.1016/j.envint.2024.109031 [Crossref] [ Google Scholar]
- Eapen JV, Thomas S, Antony S, George P, Antony J. A review of the effects of pharmaceutical pollutants on humans and aquatic ecosystem. Explor Drug Sci 2024;2(5):484-507. dol: 10.37349/eds.2024.00058.
- Karungamye P, Rugaika A, Mtei K, Machunda R. The pharmaceutical disposal practices and environmental contamination: a review in East African countries. HydroResearch 2022; 5:99-107. doi: 10.1016/j.hydres.2022.11.001 [Crossref] [ Google Scholar]
- Okeke ES, Ezeorba TPC, Okoye CO, Chen Y, Mao G, Feng W. Environmental and health impact of unrecovered API from pharmaceutical manufacturing wastes: a review of contemporary treatment, recycling and management strategies. Sustain Chem Pharm 2022; 30:100865. doi: 10.1016/j.scp.2022.100865 [Crossref] [ Google Scholar]
- de Oliveira Souza H, dos Santos Costa R, Quadra GR, dos Santos Fernandez MA. Pharmaceutical pollution and sustainable development goals: going the right way?. Sustain Chem Pharm 2021; 21:100428. doi: 10.1016/j.scp.2021.100428 [Crossref] [ Google Scholar]
- Cunha MR, Lima EC, Lima DR, da Silva RS, Thue PS, Seliem MK. Removal of captopril pharmaceutical from synthetic pharmaceutical-industry wastewaters: use of activated carbon derived from Butiacatarinensis. J Environ Chem Eng 2020; 8(6):104506. doi: 10.1016/j.jece.2020.104506 [Crossref] [ Google Scholar]
- Khan MH, Akash NM, Akter S, Rukh M, Nzediegwu C, Islam MS. A comprehensive review of coconut-based porous materials for wastewater treatment and CO2 capture. J Environ Manage 2023; 338:117825. doi: 10.1016/j.jenvman.2023.117825 [Crossref] [ Google Scholar]
- Lewoyehu M. Comprehensive review on synthesis and application of activated carbon from agricultural residues for the remediation of venomous pollutants in wastewater. J Anal Appl Pyrolysis 2021; 159:105279. doi: 10.1016/j.jaap.2021.105279 [Crossref] [ Google Scholar]
- Nordin AH, Abdul Samad N, Paiman SH, Noor SF, Rushdan AI, Ngadi N. A mini review on aspirin removal by carbon/noncarbon-based adsorbents from aqueous solution. Mater Today Proc 2024; 96:30-4. doi: 10.1016/j.matpr.2023.08.373 [Crossref] [ Google Scholar]
- Shamsollahi Z, Partovinia A. Recent advances on pollutants removal by rice husk as a bio-based adsorbent: a critical review. J Environ Manage 2019; 246:314-23. doi: 10.1016/j.jenvman.2019.05.145 [Crossref] [ Google Scholar]
- Pebriana RB, Damayanti O, Agustin YD, Lukitaningsih E, Bestari AN. Validation of a high-performance liquid chromatographic method for the assay and dissolution of captopril in mucoadhesive tablet formulation. J Appl Pharm Sci 2021; 11(2):66-74. doi: 10.7324/japs.2021.110209 [Crossref] [ Google Scholar]
- The European Pharmacopoeia Commission. European Pharmacopoeia. 6th ed. Strasbourg: Council of Europe; 2007.
- The United States Pharmacopoeia Convention. The United States Pharmacopoeia, 43th Revision, the National Formulary. 38th ed. Rockville: United Book Press Inc; 2020.
- Veerubhotla K, Walker RB. Development and validation of a stability-indicating RP-HPLC method using quality by design for estimating captopril. Indian J Pharm Sci 2019; 81(1):45-56. doi: 10.4172/pharmaceutical-sciences.1000478 [Crossref] [ Google Scholar]
- Zammit G, Cassar R, Pace M. Quantification of captopril using ultra high-performance liquid chromatography. Pharm Methods 2022; 13(1):7-10. doi: 10.35248/2229-4708.22.13.223 [Crossref] [ Google Scholar]
- Böger B, de Oliveira Vilhena R, Fachi MM, Concentino V, Junkert AM, Santos JM. HPLC-MS/MS method for quantification of pharmaceuticals in subtropical rivers and water treatment plants in Brazil. J Environ Sci Public Health 2020; 4:390-408. doi: 10.26502/jesph.96120109 [Crossref] [ Google Scholar]
- Mahmoud WM, Kümmerer K. Captopril and its dimer captopril disulfide: photodegradation, aerobic biodegradation and identification of transformation products by HPLC–UV and LC–ion trap-MSn. Chemosphere 2012; 88(10):1170-7. doi: 10.1016/j.chemosphere.2012.03.064 [Crossref] [ Google Scholar]
- Santos LR, de Souza Moreira CP, Dutra RC, de Sousa Ribeiro Vasconcelos OM, Magalhães SM, Mol MP. Degradation of the pharmaceutical captopril via Fenton process. Environ Eng Manag J 2021; 20(11):1739-44. doi: 10.30638/eemj.2021.163 [Crossref] [ Google Scholar]
- Cortes-Diaz MJA, Rodríguez-Flores J, Castañeda-Peñalvo G, Galar-Martínez M, Islas-Flores H, Dublán-García O. Sublethal effects induced by captopril on Cyprinus carpio as determined by oxidative stress biomarkers. Sci Total Environ 2017; 605-606:811-23. doi: 10.1016/j.scitotenv.2017.06.208 [Crossref] [ Google Scholar]
- García-Valdespino F, Elizalde-Velázquez GA, Herrera-Vázquez SE, Gómez-Oliván LM. Captopril’s influence on Danio rerio embryonic development: unveiling significant toxic outcomes at environmentally relevant concentrations. Sci Total Environ 2024; 933:173179. doi: 10.1016/j.scitotenv.2024.173179 [Crossref] [ Google Scholar]
- International Conference on Harmonization. Q2(R1) Validation of Analytical Procedures: Text and Methodology. 2005. Available from: https://database.ich.org/sites/default/files/Q2%28R1%29%20Guideline.pdf. Accessed March 26, 2025.
- Pena-Pereira F, Wojnowski W, Tobiszewski M. AGREE-analytical GREEnness metric approach and software. Anal Chem 2020; 92(14):10076-82. doi: 10.1021/acs.analchem.0c01887 [Crossref] [ Google Scholar]
- Płotka-Wasylka J. A new tool for the evaluation of the analytical procedure: Green Analytical Procedure Index. Talanta 2018; 181:204-9. doi: 10.1016/j.talanta.2018.01.013 [Crossref] [ Google Scholar]
- Manousi N, Wojnowski W, Płotka-Wasylka J, Samanidou V. Blue applicability grade index (BAGI) and software: a new tool for the evaluation of method practicality. Green Chem 2023; 25(19):7598-604. doi: 10.1039/d3gc02347h [Crossref] [ Google Scholar]
- Assassi AL, Roy CE, Perovitch P, Auzerie J, Hamon T, Gaudin K. Green analytical method development for statin analysis. J Chromatogr A 2015; 1380:104-11. doi: 10.1016/j.chroma.2014.12.066 [Crossref] [ Google Scholar]
- Wadie M, Abdel-Moety EM, Rezk MR, Tantawy MA. Eco-friendly chiral HPLC method for determination of alfuzosin enantiomers and solifenacin in their newly pharmaceutical combination: Method optimization via central composite design. Microchem J 2021; 165:106095. doi: 10.1016/j.microc.2021.106095 [Crossref] [ Google Scholar]
- Mirza T, Tan HS. Determination of captopril in pharmaceutical tablets by anion-exchange HPLC using indirect photometric detection; a study in systematic method development. J Pharm Biomed Anal 2001; 25(1):39-52. doi: 10.1016/s0731-7085(00)00462-3 [Crossref] [ Google Scholar]
- Ahmed S, Rizk M, Belal F, Ibrahim F, Sheribah ZA. Stability‐indicating HPLC method for captopril through pre‐column derivatization with Pd(II). J Liq Chromatogr Relat Technol 2006; 29(4):521-32. doi: 10.1080/10826070500478999 [Crossref] [ Google Scholar]
- Leanpolchareanchai J, Suksiriworapong J. Validation of analytical method for captopril extemporaneous preparations by high performance liquid chromatography. MU J Pharm Sci 2015; 42(2):85-92. [ Google Scholar]
- Lee TY, Notari RE. Kinetics and mechanism of captopril oxidation in aqueous solution under controlled oxygen partial pressure. Pharm Res 1987; 4(2):98-103. doi: 10.1023/a:1016406716989 [Crossref] [ Google Scholar]
- United Nations. The 17 Sustainable Development Goals (SDGS). New York: United Nations; 2024. Available from: https://sdgs.un.org/goals. Accessed March 26, 2025.