Pharmaceutical Sciences. 2025;31(3):270-278.
doi: 10.34172/PS.025.42216
Research Article
Rapid, Multi-Sample Assay of Gabapentin in Capsules Using Easy-to-Setup and Low-Cost Smartphone-Based Fluorescence Measurement
Thana Thanayutsiri Formal analysis, Investigation, Methodology, Visualization, Writing – original draft, 1 
Thapakorn Charoenying Formal analysis, Investigation, 1
Supusson Pengnam Formal analysis, Investigation, 2
Praneet Opanasopit Formal analysis, Writing – original draft, 1
Tanasait Ngawhirunpat Formal analysis, 1
Akhayachatra Chinsriwongkul Resources, 3
Theerasak Rojanarata Conceptualization, Formal analysis, Funding acquisition, Methodology, Project administration, Writing – review & editing, 1, *
Author information:
1Department of Industrial Pharmacy, Faculty of Pharmacy, Silpakorn University, Nakhon Pathom, 73000, Thailand
2Department of Biomedicine and Health Informatics, Faculty of Pharmacy, Silpakorn University, Nakhon Pathom 73000, Thailand
3Newcharoen Pharmaceutical L.P., Pathumthani 12120, Thailand
Abstract
Background:
Pharmacopeial methods for the quantification of gabapentin (GBP), particularly high-performance liquid chromatography (HPLC), require costly instrumentation, unsafe solvents in mobile phase, and time-consuming procedures. While fluorometric methods exist, they also employ expensive fluorometers. This study aimed to develop a cost-effective, eco-friendly GBP assay using smartphone-based digital image fluorometry (SDIF) for rapid multi-sample analysis of GBP in pharmaceutical capsules.
Methods:
GBP was reacted with fluorescamine in borate buffer (pH 9.0) for 2 minutes, producing a blue fluorescent product under UV light. Fluorescence intensity was captured using a smartphone inside a dark box with low-cost UV LEDs (395 nm). GBP concentration was determined from green (G) channel intensity using a logarithmic calibration curve. The method was optimized, validated per USP guidelines, and compared with USP HPLC. Greenness and practicality were evaluated.
Results:
The SDIF method exhibited excellent linearity (r2=0.9994) over GBP concentrations of 0.2–4.0 µg/mL, with high accuracy (98%–102% recovery) and precision (RSD<2%). No interference was observed from capsule excipients or the impurity GBP-related compound A. Assay results showed no significant difference from the USP HPLC method. Compared to HPLC, the SDIF method demonstrated a greener profile by using acetone instead of acetonitrile. Although requiring derivatization and offering lower automation than HPLC, SDIF achieved a satisfactory Blue Applicability Grade Index (BAGI) score of 65.0, indicating practical applicability. Additionally, the method allowed simultaneous measurement of six samples and six standard solutions, unlike HPLC or fluorometers, which measure only one at a time.
Conclusion:
SDIF eliminates the need for fluorometers or HPLC, using inexpensive and simple equipment for rapid, multi-sample GBP analysis. With its green profile and practicality, SDIF offers a viable alternative for routine quality control, particularly in resource-limited settings.
Keywords: Smartphone, Digital image, Fluorometry, Gabapentin, Fluorescamine
Copyright and License Information
© 2025 The Author(s).
This is an open access article and applies the Creative Commons Attribution Non-Commercial License (
http://creativecommons.org/licenses/by-nc/4.0/). Non-commercial uses of the work are permitted, provided the original work is properly cited.
Funding Statement
This research is financially supported by Thailand Science Research and Innovation (TSRI), National Science, Research and Innovation Fund (NSRF) (Fiscal Year 2025).
Introduction
Smartphone-based digital image colorimetry (SDIC) has emerged as a powerful analytical tool for quantifying analytes across diverse fields, including environmental monitoring, food safety, clinical diagnostics, and pharmaceutical analysis.1-3 This technique leverages the advanced imaging capabilities of modern smartphones to capture and analyze the color of test samples, offering a viable alternative to traditional UV-vis spectrophotometry in many applications. At its core, SDIC extracts color information using color space models, such as red-green-blue (RGB), cyan-magenta-yellow-black (CMYK), or grayscale. When a sample undergoes a chromogenic reaction, its color intensity correlates with the analyte concentration. The smartphone camera captures images of the sample, and image-processing algorithms extract RGB values, which are then converted into analyte concentrations using a calibration curve. SDIC offers several advantages that make it an attractive analytical approach. Its accessibility and cost-effectiveness eliminate the need for expensive laboratory equipment, such as UV-Vis spectrophotometers, making it particularly suitable for resource-limited settings. Additionally, its portability enables convenient field measurements. Despite these advantages, certain factors can affect the accuracy and reproducibility of SDIC, including variations in ambient lighting, differences in smartphone camera specifications, and challenges in standardizing image acquisition conditions. However, these limitations can be minimized through proper calibration, controlled lighting setups, and optimized image processing techniques, ensuring reliable and consistent analytical performance.
Building on the principles of SDIC, smartphone-based digital image fluorometry (SDIF) offers a promising alternative for fluorescence measurements in the visible light range. Although less documented than SDIC, SDIF has been applied in several fields, including the analysis of Cu2+ in mineral and tap water,4 paper-based determination of β-glucosidase activity in crude almond and human serum,5 and hydrogen peroxide detection in milk samples.6 In pharmaceutical quality control, SDIF’s applications remains underexplored, with methods only being reported for the analysis of tobramycin7 and gentamicin8 formulations. While these SDIF assays offer the advantage of cost-effectiveness by eliminating the need for costly spectrofluorometers, several limitations hinder their widespread adoption. Many require custom-made smartphone attachments (often 3D-printed),7,8 rely on non-commercial or uncommon fluorogenic reagents, e.g., carbon dots9,10 or gold nanoparticles,11 or are limited to single-sample measurement.7-11 These constraints significantly reduce their practicality for routine pharmaceutical quality control. Given these challenges, there remains a need for rapid and user-friendly SDIF assays that use readily available reagents and simple, easy-to-setup equipment while enabling the simultaneous analysis of multiple samples for pharmaceutical quality control.
Gabapentin (GBP), a structural analog of γ-aminobutyric acid (GABA), is prescribed for the treatment of epilepsy, neuropathic pain, restless legs syndrome, and other conditions. Available in various formulations, including capsules, tablets, and oral solutions, GBP dosage forms requires reliable analytical methods for accurate quantification. The United States Pharmacopeia (USP) and other pharmacopoeias recommend reversed-phase high-performance liquid chromatography (HPLC) as the standard assay method for GBP.12,13 Although HPLC offers high sensitivity and accuracy, it is time-consuming, requires expensive instrumentation, and relies on unsafe organic solvents, such as acetonitrile and methanol, for the mobile phase.
In addition to HPLC, several colorimetric methods have been developed for the assay of GBP, involving chromogenic reactions with the drug. However, these assays often utilize hazardous chemicals, such as ninhydrin,14 acetylacetone/formaldehyde,15 or 2,4-dinitrophenol,16 which raise concerns about safety and environmental impact. To address these issues, Winotapun et al17 proposed a greener method using genipin, a naturally derived reagent, that offers enhanced safety and environmental compatibility. Despite these advantages, this method requires a 60-minute heating step, limiting its practicability for rapid analysis.
In terms of fluorometric assays, the use of fluorogenic derivatizing agents, such as fluorescamine, have also been reported.18 While these methods offer high sensitivity, they require the use of a spectrofluorometer, which is more expensive and less accessible than a UV-vis spectrophotometer, making them unsuitable for routine analysis in many laboratories. Other methods, such as capillary electrophoresis19 and electrochemical techniques,20 have also been reported for GBP quantification; however, these methods present challenges related to complexity, cost, and their suitability for pharmaceutical quality control.
Given these limitations, there is a need for more practical, affordable, and environmentally friendly methods to quantify GBP in pharmaceutical formulations. As SDIF offers a potential alternative for drug quantification, the aim of this study was to develop a novel assay for GBP in capsules based on this approach. The method relies on the reaction between GBP’s primary amine group and fluorescamine, a common fluorogenic reagent, which produces a blue fluorescent product when excited by UV light at 390-400 nm. The method was optimized and validated following USP guidelines, and its analytical performance was compared to the standard USP HPLC method. Additionally, the greenness and practicality of the method were assessed using established metrics.
Materials and Methods
Chemicals and instrumentation
GBP (purity ≥ 99%), GBP-related compound A (purity ≥ 99%), and fluorescamine (purity ≥ 98%) were obtained from Sigma Aldrich (MO, USA). Acetone, acetonitrile, and boric acid were sourced from Merck (Germany). GBP capsules (400 mg per capsule) were purchased from a drugstore in Thailand, with additional tablet ingredients including corn starch, anhydrous lactose, and talc. An iPhone 11 Pro served as the camera, while 395 nm UV LED lamps provided the UV light source. The standard assay (USP) for GBP capsules was conducted using the Agilent 1220 Infinity LC System (Agilent Technologies, Germany) for comparison with the proposed SDIC method.
Procedure for fluorescamine -based reaction in the proposed assay
The fluorogenic reaction was performed by adding 100 µL of a 1 mg/mL fluorescamine solution (prepared in acetone) to a mixture containing 500 mL of 200 mM borate buffer, pH 9.0, and 500 µL of either the GBP standard solution (0.2, 0.4, 0.8, 1.6, 3.2, 4.0 µg/mL) or the sample solution (approximately 0.8 µg/mL), both prepared in water, in a 1.5 mL microcentrifuge tube. The mixture was vortexed for 10 s and incubated at room temperature for 2 minutes. Fluorescence intensities were then acquired upon UV excitation by means of smartphone imaging and RGB analysis.
Fluorescence measurement and analysis by SDIF
After the reaction, 1 mL of each resulting solution was transferred to a cuvette. A series of cuvettes containing both standard and sample solutions were then arranged in a row inside a custom-built dark box equipped with LED lamps emitting UV light at 395 nm (Figure 1). Upon UV exposure, the GBP-containing solutions emitted blue fluorescence. For image acquisition, an iPhone 11 Pro camera was set to autofocus mode with a 12 MP resolution, f/1.8 aperture, and flash disabled. The camera was positioned 25 cm from the cuvettes, capturing all standard and sample solutions in a single frame from a front side.

Figure 1.
Custom-built photographic chamber for smartphone-based fluorescence measurement (a) using low-cost commercially available UV-LEDs (b), and RGB acquisition from the image (c), showing examples of G values extracted from the fluorogenic reaction of GBP in a cuvette and from the image background with a G value of 0
.
Custom-built photographic chamber for smartphone-based fluorescence measurement (a) using low-cost commercially available UV-LEDs (b), and RGB acquisition from the image (c), showing examples of G values extracted from the fluorogenic reaction of GBP in a cuvette and from the image background with a G value of 0
RGB values of the blue fluorescence were extracted from the digital image using the RGB Color Detector, a free mobile application available on both the App Store (iOS) and Play Store (Android). A standard curve was constructed by plotting G value as the analytical signal against the logarithm of GBP concentration. Analyte concentrations were determined using the regression equation derived from the standard curve.
Method validation
To evaluate the analytical performance, the method was validated following the guidelines outlined in < 1225 > Validation of Compendial Procedures from the USP 43.12 The relationship between the analytical signal and drug concentration was assessed by generating a standard curve for GBP within a concentration range of 0.2 to 4.0 µM, followed by determining the regression equation and the coefficient of determination (r2). The standard curve data in the lower concentration range (0.2–0.5 µg/mL), which exhibited linearity, were used to calculate the limit of detection (LOD) and limit of quantitation (LOQ), defined as 3.3 and 10 times the standard deviation of the Y-intercept divided by the slope, respectively. Accuracy was determined by spiking known amounts of standard GBP at three concentration levels (75%, 100%, 125% of the target concentration) into a capsule placebo (n = 3 per level), followed by assay of the spiked samples, with recovery expressed as a percentage. Intra-day and inter-day precision were assessed by analyzing commercial capsules within a single day and across three consecutive days (n = 6), respectively. Results were reported as the percentage relative standard deviation (%RSD) of the labeled amount. Specificity was evaluated by assaying a known quantity of GBP in the presence of excipients commonly used in capsule formulations, and the impurity, 2-azaspiro[4,5]decan-3-one (GBP-related compound A).
HPLC analysis
The USP assay for GBP capsules, based on HPLC,12 was employed to compare analytical results with those obtained using the SDIC method. Briefly, both the standard and sample solutions were prepared at a concentration of 4.0 mg/mL (23.4 mM) of GBP. The analysis was conducted using a C8 column (4.6 mm × 25 cm, 5 μm particle size; VertiSepTM GES, Vertical Chromatography Co., Ltd., Bangkok, Thailand) with isocratic elution. The mobile phase consisted of 8.8 mM KH₂PO₄ in water and acetonitrile (94:6 v/v), adjusted to pH 6.9 using 5 M KOH. The flow rate was set at 1.2 mL/min, with an injection volume of 50 μL. The column temperature was maintained at 25 °C, and detection was performed at 210 nm using a diode array UV detector. The percentage of the labeled GBP content in the capsule was determined by comparing the peak areas of the sample and standard solutions.
Results and Discussion
Optimization of fluorescamine-based reaction
Since GBP does not inherently fluoresce strongly, a fluorogenic reagent is necessary to enable fluorescence-based analysis. Fluorescamine, a well-known and commercially available reagent, reacts selectively with primary amines, forming a highly blue fluorescent product. The advantage of fluorescamine lies in its lack of intrinsic fluorescence, which ensures a low background signal and enhances sensitivity. Due to its rapid and specific reaction, fluorescamine is widely employed for analyzing amine-containing compounds, including amino acids, peptides, proteins, and pharmaceuticals.21 Since the presence of a primary amine group in GBP, fluorescamine can react with GBP (Figure 2), offering an ideal choice for the analysis and thus used in this work.

Figure 2.
The fluorogenic reaction of GBP with fluorescamine
.
The fluorogenic reaction of GBP with fluorescamine
As a standard protocol, the fluorescamine reaction is typically performed in aqueous or buffered solutions, with borate buffer commonly used to maintain an optimal alkaline pH of 8–9. However, other reaction parameters, such as fluorescamine concentration and reaction time, need to be optimized based on the type and concentration of the analyte. Therefore, in this study, these two parameters were initially optimized to achieve efficient quantification of GBP.
As shown in Figure 3, which depicts the results from the experiment using a 4 µg/mL GBP solution—the highest concentration in the standard curve—increasing the fluorescamine concentration from 0.2 to 1 mg/mL led to higher fluorescence, as indicated by the increasing G value, which correlates with the intensity of blue fluorescence. However, increasing the concentration beyond 1 mg/mL did not result in a significant further increase in the analytical signal, as the available GBP had already been consumed. Based on these results, a fluorescamine concentration of 1 mg/mL was selected for the proposed assay, as it provided high sensitivity while minimizing reagent usage. Regarding reaction time, the reaction was found to be complete at room temperature after 2 minutes, as a 1-min incubation resulted in a lower G signal (approximately 90% of the maximum G value). Furthermore, the resulting fluorescence remained stable for at least 15 minutes, indicating that fluorescence measurements can be reliably performed at any time between 2 and 15 minutes after incubation.

Figure 3.
Effect of fluorescamine concentration on G value, studied using 4 µg/mL GBP
.
Effect of fluorescamine concentration on G value, studied using 4 µg/mL GBP
Development and optimization of a low-cost smartphone fluorescence imaging system
Traditionally, fluorometric assays using fluorescamine require a fluorometer with excitation and emission wavelengths set at 390 nm (near UV) and 470 nm (blue), respectively. To adapt this for smartphone-based detection, we fabricated a low-cost and easy-to-setup photographic chamber (Figure 1a). A cardboard box, with its interior walls painted black, served as a dark chamber to minimize external light interference, ensuring a stronger and clearer signal from the samples. A panel of UV LEDs (390–400 nm) (Figure 1b) was installed at the top of the box to illuminate the samples, while a small aperture at the front allowed a smartphone camera to capture images of the cuvettes, positioned as shown in Figure 1a. This simple but effective setup facilitated reliable image acquisition. Additionally, the use of a smartphone and UV-LED lamps (costing approximately US$ 6) rendered this method significantly more economical than conventional fluorometric analysis with a fluorometer.
Digital camera images often exhibit non-uniform illumination, where peripheral areas appear dimmer than the central region, leading to differences in color intensity and, ultimately, inaccurate RGB value acquisition.22 To address this issue, we investigated the maximum number of cuvettes per row captured per frame by analyzing G values extracted from images containing varying numbers of aligned cuvettes, each filled with a 0.8 mg/mL GBP reaction solution—the target drug concentration in the assay. As expected, variation in G values, measured by %RSD, increased with the number of aligned cuvettes (Table 1). To maintain an RSD below 2%, no more than 12 cuvettes should be included in a single shot. Based on this finding, the proposed assay enables simultaneous measurement of six samples and six standard solutions, offering a faster alternative to HPLC or fluorometers, which analyze only one sample at a time.
Table 1.
Effect of cuvette numbers aligned in a row on G values
|
Number of tube
|
16
|
14
|
12
|
10
|
8
|
| Average G |
66.54 |
68.10 |
68.76 |
69.06 |
69.05 |
| SD |
4.78 |
2.21 |
1.15 |
1.01 |
0.59 |
| %RSD |
7.19 |
3.25 |
1.67 |
1.46 |
0.85 |
Beyond its speed, capturing an image of multiple samples alongside standard solutions in a single shot offers the additional advantage of minimizing variations in lighting conditions between shots. By adopting a calibration technique— where analyte concentrations are determined by comparing the G values of samples to a standard curve derived from the same image—high accuracy was achieved. Unlike some previously reported smartphone-based fluorescence detection devices that capture one sample at a time and require precise design to ensure consistent photographic conditions,7,8 the proposed method reduces the need for such rigorous device optimization.
Selection of RGB signal
To establish the relationship between the blue fluorescence intensity and the drug concentration, a suitable analytical signal was investigated by fitting various functions of red (R), green (G), and blue (B) color intensities with different functions of GBP concentration. A strong linear relationship was observed between the G value and the logarithm of GBP concentration. Additionally, the regression equation for G had a steeper slope compared to similar relationships with R and B (Figure 4 and Supplementary file 1, Table S1). This relationship was described by the regression equation y = 43.628 ln(x) + 90.866, where y represents the G value and x represents the GBP concentration (µg/mL). The high correlation coefficient (r2 = 0.9994) indicated excellent linearity and suitability for quantitative analysis. While calibration curves with a linear relationship between concentration and response are more commonly used in analytical chemistry, calibration curves on a logarithmic scale of concentration are also possible and have been applied in various studies.23-26 Despite the controversy and concerns regarding the validity of such standard curves,27-30 the recovery results (“Method validation results” section), studied over the concentration range of 75-125% of the target concentration, confirmed that the log concentration versus analytical signal (G) relationship was reliable and effective for the proposed assay.
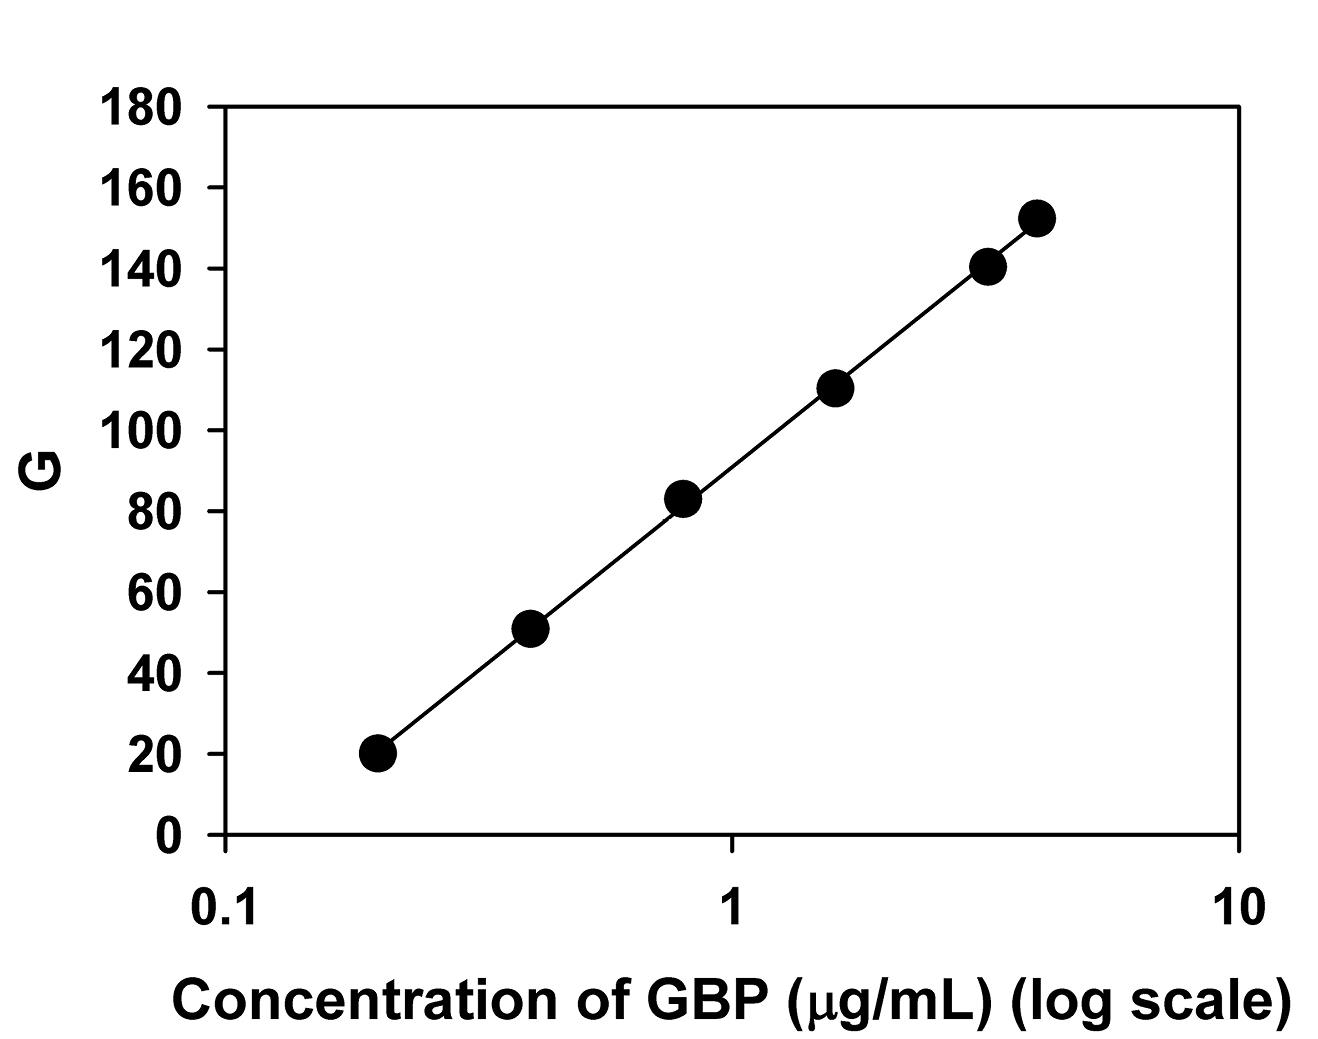
Figure 4.
The relationship of concentration of GBP (µg/mL) in a logarithmic scale and G, used as a standard curve for the SDIF assay
.
The relationship of concentration of GBP (µg/mL) in a logarithmic scale and G, used as a standard curve for the SDIF assay
The LED lamps used in the assay emitted light in the 390–400 nm range (at the boundary between UV and visible light), producing a violet illumination. However, as shown in Fig. 1c, this violet light did not interfere with the analysis, as a null G value was recorded against this background (Figure 1a). This demonstrates the G channel’s selectivity for the analyte’s fluorescence and its independence from the excitation light.
Method validation results
The proposed SDIF assay demonstrated good linearity (Table 2). Although the target analyte’s naturally high concentration places it in Category I of USP: validation of compendial procedures (analytical procedures for quantitation of major components of bulk drug substances or active ingredients in finished pharmaceutical products), where LOD and LOQ determination is not mandatory, these parameters were nonetheless calculated and found to be 0.059 and 0.179 µg/mL, respectively. The method exhibited excellent accuracy, with recoveries within 98%–102% across all three tested concentrations, and high precision, with %RSD below 2% for both intra-day and inter-day precision. As shown in Table 3, the specificity was confirmed by the near-100% recoveries, meaning that the fluorescamine-based assay was unaffected by common capsule excipients and GBP related compound A (an impurity controlled in the USP monograph for GBP capsules). The substances were tested at the concentrations commonly used for ingredients in the formulation, or at twice the impurity limit for GBP Related Compound A. The absence of primary amine groups in these potentially interfering substances prevented them from reacting with fluorescamine to produce a fluorescent product, ensuring accurate GBP recoveries even in their presence.
Table 2.
Summary of the method validation results
|
Parameter
|
Result
|
| Regression equation |
y = 43.628 ln(x) + 90.866
when y is G and x is concentration of GBP (µg/mL) |
| r2 |
0.9994 |
| Range |
0.2–4.0 µg/mL |
| LOD |
0.059 µg/mL |
| LOQ |
0.179 µg/mL |
| Accuracy |
|
| % Recovery (n = 3, for each level) |
98.65 ± 0.70% (low; spiked with 0.6 µg/mL) |
99.90 ± 1.20% (medium; spiked with 0.8 µg/mL)
100.64 ± 0.95% (high; spiked with 1.0 µg/mL) |
| Precision |
|
| %RSD for intra-day precision (n = 6) |
1.75% |
| %RSD for inter-day precision (n = 18) |
1.51% |
Table 3.
Specificity of the method
|
Substance
|
Added amount (mg)*
|
% Recovery±SD
|
| GBP Related Compound A |
3.2 |
99.76 ± 2.11 |
| Lactose |
200 |
100.57 ± 2.15 |
| Talcum |
4 |
98.72 ± 1.79 |
| Corn starch |
100 |
98.65 ± 1.91 |
* mg of substance added to 400 mg of gabapentin to prepare a test mixture.
Comparison of the assay performance with the standard HPLC methods and other methods
The applicability of the SDIF method was demonstrated by quantifying GBP in the same commercial capsule samples using both the proposed method and the USP method. The results, expressed as a percentage of the labeled amount, were compared between the two methods. The chromatograms obtained from the USP method are shown in (Figure 5), illustrating the analysis time of approximately 8 min per sample. No significant difference was observed between the % labeled amounts obtained using the proposed SDIF method (101.35 ± 0.80%) and the USP method (100.90 ± 0.24%), with the calculated t-value (0.0568) being lower than the critical t-value (3.8853). Therefore, the SDIF assay is suitable alternative for analyzing GBP content in capsule formulations, providing results consistent with the standard USP method.
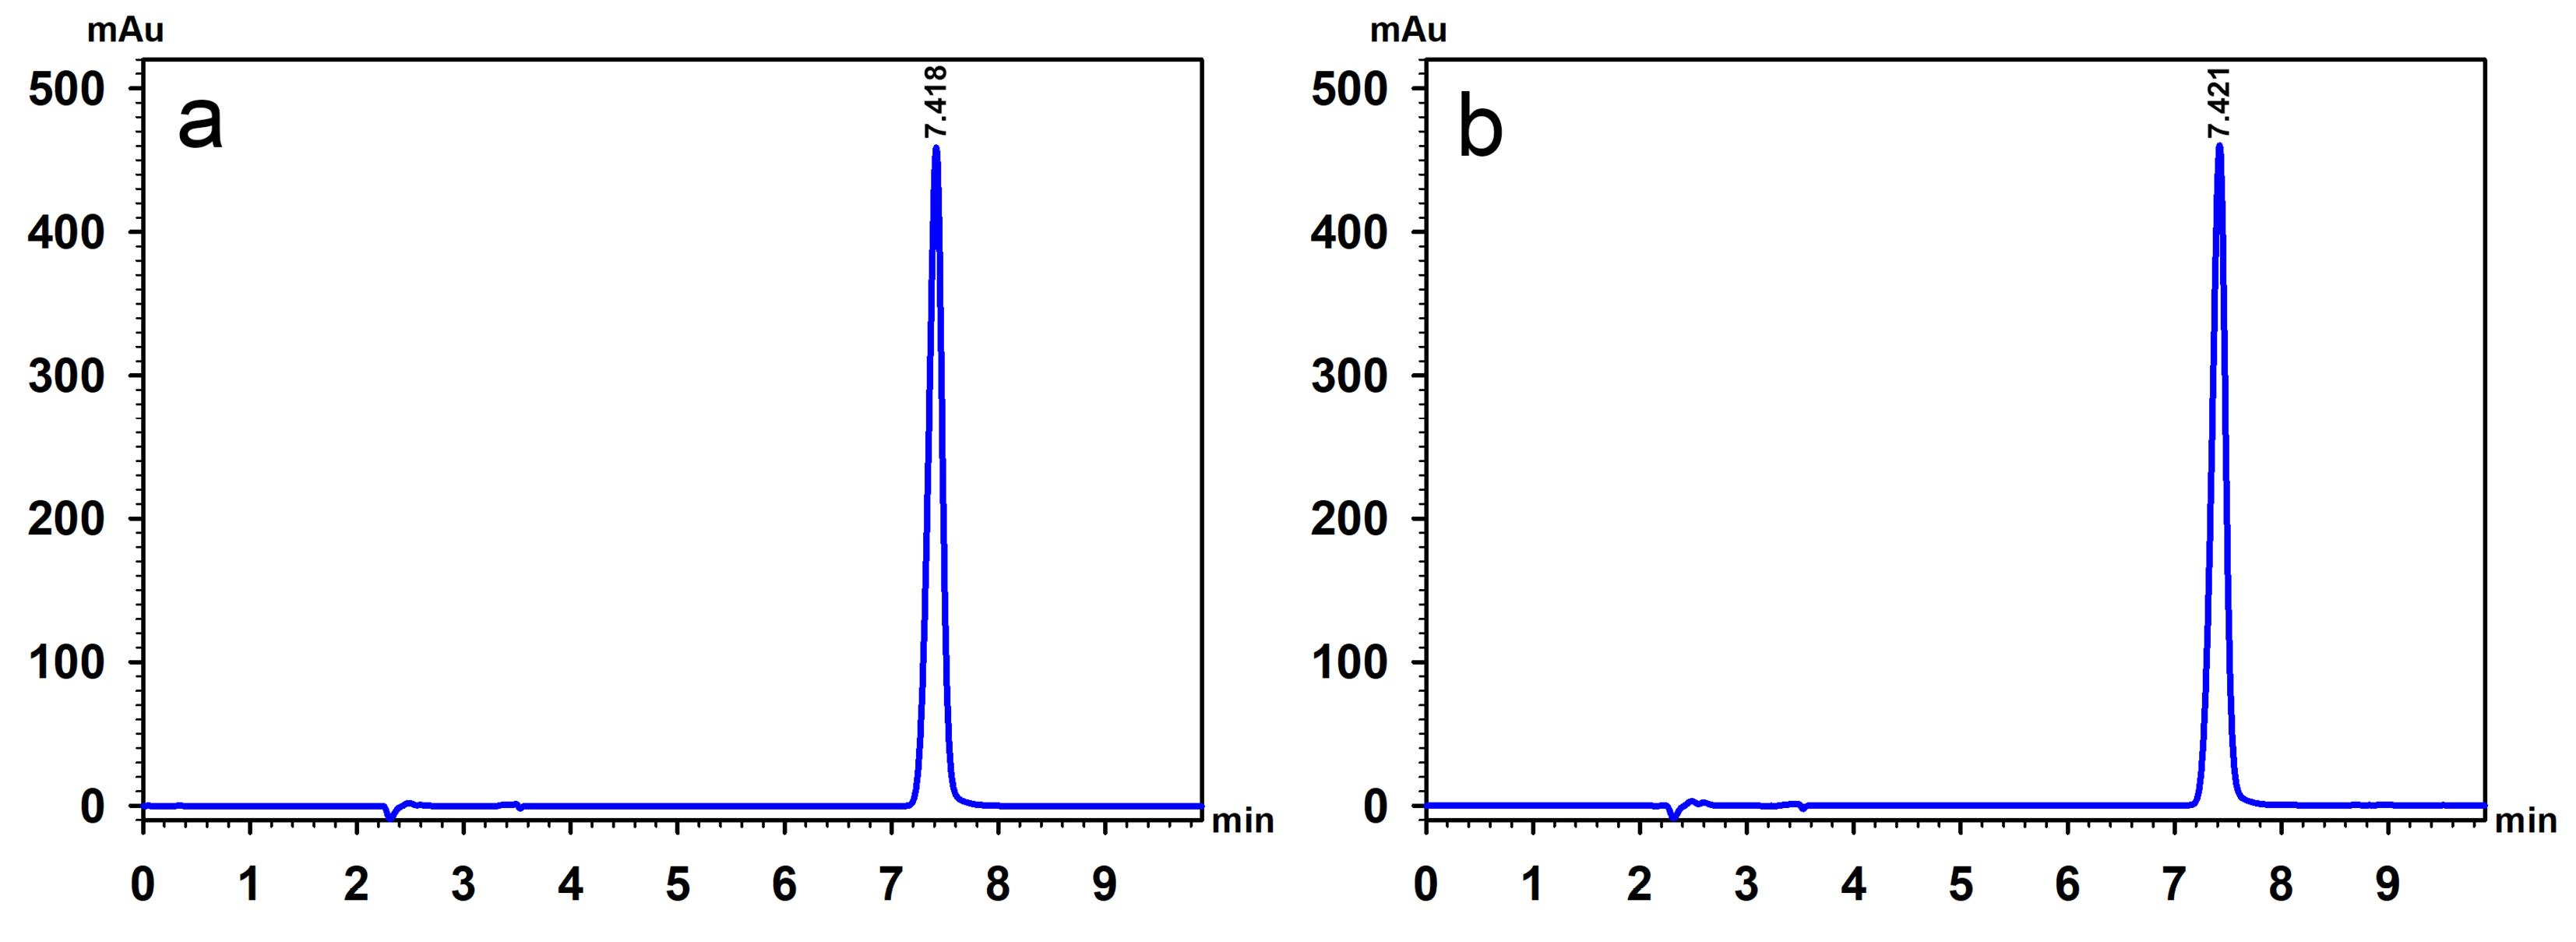
Figure 5.
HPLC chromatograms of a 4 mg/mL standard GBP solution (a) and a sample solution containing a nominal 4 mg/mL of gabapentin prepared from commercial capsules (b), analyzed using the USP method
.
HPLC chromatograms of a 4 mg/mL standard GBP solution (a) and a sample solution containing a nominal 4 mg/mL of gabapentin prepared from commercial capsules (b), analyzed using the USP method
The proposed SDIF method offers several advantages over other published analytical methods used for gabapentin quantification in pharmaceutical dosage forms, including simplicity, cost-effectiveness, and efficiency. As summarized in Table 4, it requires only a smartphone and LEDs, making it much more affordable compared to methods requiring expensive instruments like UV-vis spectrophotometers,14,17,31 spectrofluorometers,18 and HPLC.32 Additionally, the reaction time is rapid (2 minutes without heating), significantly faster than methods that require lengthy heating or incubation times. The proposed method also supports multi-sample measurement, unlike methods such as HPLC that are limited to single-sample analysis. With a low detection limit (0.059 µg/mL) and a reasonable limit of quantification (0.179 µg/mL), it provides sensitivity comparable to other techniques, making it a practical and efficient choice for gabapentin analysis.
Table 4.
Comparison of some analytical methods for gabapentin quantification in pharmaceutical dosage forms
|
Method |
Instrument required
|
Linear range (µg/mL)
|
LOD (µg/mL)
|
LOQ (µg/mL)
|
Remarks
|
| Proposed SDIF in this study |
Smartphone/LEDs |
0.2–4.0 |
0.059 |
0.179 |
Use simple and inexpensive equipment, reaction time of 2 min without heating, multi-sample measurement |
| Colorimetry using genipin17 |
UV-vis spectrophotometer |
25.7–85.7 |
0.685 |
2.400 |
Heating for 60 min required for color formation |
| Colorimetry using sodium 1, 2-naphthoquinone-4-sulfonate31 |
UV-vis spectrophotometer |
7.5-75 |
2.46 |
7.46 |
Reaction time of 20 min |
| Colorimetry using ninhydrin14 |
UV-vis spectrophotometer |
2-30 |
0.16 |
0.454 |
Heating for 20 min required for color formation |
| Fluorometry using fluorescamine18 |
Spectrofluorometer |
0.1-1.0 |
0.06 |
0.20 |
Expensive instrument required |
| HPLC32 |
HPLC |
2.5-7.5 |
NP |
NP |
Expensive and sophisticated instrument required, single sample analysis |
Greenness and practicability of the proposed method
The greenness of the proposed SDIF method was evaluated in comparison with the USP method using two established greenness metrics. While the Green Analytical Procedure Index (GAPI)33 revealed a similar profile for both methods (5 green, 4 yellow, and 5 red sections), the Analytical Greenness Metric (AGREE) score34 favored the SDIF method with a score of 0.63 over the USP method which had a score of 0.55 (Table 5), indicating a greener approach. Although both methods utilize organic solvents, the SDIF method’s use of acetone as a solvent the fluorescamine solution offers a significant green advantage over the USP method’s use of acetonitrile in the HPLC mobile phase. In addition, the 100 µL of fluorescamine solution containing acetone per sample was significantly less than the several milliliters of acetonitrile required for mobile phase and diluent preparation. Acetone is generally considered a greener and safer solvent due to its lower toxicity, ready biodegradability, and reduced contribution to air pollution. In contrast, acetonitrile is classified as toxic and presents greater health risks. Furthermore, bio-based acetone, produced through fermentation of plant-derived materials, offers the potential to further minimize the carbon footprint associated with solvent production. While fluorescamine requires careful handling, its rapid reactivity with water and subsequent degradation into non-fluorescent products minimize concerns about long-term environmental persistence. Additionally, it was used in a low amount, similar to acetone in this assay. These considerations collectively support the SDIF method’s alignment with green chemistry principles.
Table 5.
Assessment of greenness using GAPI and AGREE, and practicality using BAGI
|
Assessment of greenness
|
Smartphone method
|
USP method
|
| AGREE* |
|
|
| GAPI |
|
|
| BAGI |
|
|
* 1 = Sample treatment, 2 = Sample amount, 3 = Device positioning, 4 = Sample preparation Stages, 5 = Automation, miniaturization, 6 = Derivatization, 7 = Waste, 8 = Analysis throughput, 9 = Energy consumption, 10 = Source of reagents, 11 = Toxicity, 12 = Operator’s safety.
To assess the practicality and applicability of the proposed method, the Blue Applicability Grade Index (BAGI)35 was employed. This index uses a ten-criteria assessment. The score, ranging from 25 to 100 points, is represented on a blue color scale, with scores nearer to 100 and darker blue shades indicating higher performance in applicability. The proposed method achieved a BAGI score of 65.0 (Table 5), slightly lower than the USP method’s score of 72.5. This difference can be attributed to the proposed method’s need for derivatization using a reagent not commonly available in QC labs (compared to a common solvent like acetonitrile) and its lower degree of automation compared to semi-automated technique like HPLC. Despite the slightly lower BAGI score, a score above 60, as achieved by the proposed method, is generally considered “practical”.
Beyond GBP, several amine-containing drugs have been quantified in pharmaceutical dosage forms using fluorimetric methods based on their reaction with fluorescamine. Examples include tobramycin,36 lenalidomide,37 vigabatrin,18 procaine,38 and sitagliptin.39 This highlights the potential for extending the fluorescamine-based SDIF method presented in this study to the quantification of a broader range of drugs, further enhancing its applicability in pharmaceutical analysis.
Conclusion
This study developed and validated a novel, easy-to-setup, fluorometer-free, SDIF method for rapid, multi-sample GBP analysis in capsules. The method utilizes the reaction between GBP and fluorescamine, a readily available reagent, generating a blue fluorescent product detectable with a simple, low-cost setup. The method exhibited excellent analytical performance, comparable to the USP HPLC method, demonstrating good linearity, accuracy, precision, and specificity. Importantly, the SDIF method offers significant advantages in cost-effectiveness and reduced environmental negative impact due to the elimination of expensive instrumentation and the use of the greener solvent, acetone, compared to the acetonitrile used in HPLC. While requiring a derivatization step, the method achieved a BAGI score indicating practical applicability. This SDIF assay provides a viable alternative for routine GBP quality control, especially in resource-limited settings, and highlights the potential of SDIF for expanding smartphone-based analytical techniques to fluorescence-based assays. Future work may focus on automating image analysis and exploring the application of this SDIF approach to other pharmaceuticals.
Competing Interests
The authors declare that there is no conflict of interest.
Supplementary Files
Supplementary file contains Table S1.
(pdf)
References
- Fan Y, Li J, Guo Y, Xie L, Zhang G. Digital image colorimetry on smartphone for chemical analysis: a review. Measurement 2021; 171:108829. doi: 10.1016/j.measurement.2020.108829 [Crossref] [ Google Scholar]
- Qin S, Sun X, Zhao X. Advances in smartphone-based biosensors for food testing. Curr Opin Food Sci 2025; 61:101236. doi: 10.1016/j.cofs.2024.101236 [Crossref] [ Google Scholar]
- Hunt B, Ruiz A, Pogue B. Smartphone-based imaging systems for medical applications: a critical review. J Biomed Opt 2021; 26(4):040902. doi: 10.1117/1.Jbo.26.4.040902 [Crossref] [ Google Scholar]
- Batsaikhan O, Choi B, Nam H, Kim C. Fluorescent and colorimetric dual-mode chemosensor for easy detection of Cu2 + : practical and smartphone-based application to test strip and water sample. Inorganica Chim Acta 2024; 571:122234. doi: 10.1016/j.ica.2024.122234 [Crossref] [ Google Scholar]
- Zhang WY, Tian T, Peng LJ, Zhou HY, Zhang H, Chen H. A paper-based analytical device integrated with smartphone: fluorescent and colorimetric dual-mode detection of β-glucosidase activity. Biosensors (Basel) 2022; 12(10):893. doi: 10.3390/bios12100893 [Crossref] [ Google Scholar]
- Xu Z, Zeng C, Zhao Y, Zhou M, Lv T, Song C. Smartphone-based on-site detection of hydrogen peroxide in milk by using a portable ratiometric fluorescent probe. Food Chem 2023; 410:135381. doi: 10.1016/j.foodchem.2022.135381 [Crossref] [ Google Scholar]
- Mermer K, Paluch J, Fudali J, Strzelak K, Kozak J. Fluorescence-based determination of tobramycin using a portable smartphone-based device. Microchem J 2024; 207:111713. doi: 10.1016/j.microc.2024.111713 [Crossref] [ Google Scholar]
- Kubacki K, Mermer K, Paluch J, Bąk M, Strzelak K, Kozak J. Spectrofluorimetric and smartphone-based detection methods for determination of gentamicin. Monatsh Chem 2024; 155(8):899-909. doi: 10.1007/s00706-024-03244-x [Crossref] [ Google Scholar]
- Alshatteri AH, Omer KM. Smartphone-based fluorescence detection of bilirubin using yellow emissive carbon dots. Anal Methods 2022; 14(17):1730-8. doi: 10.1039/d1ay02053f [Crossref] [ Google Scholar]
- Mool-Am-Kha P, Phetduang S, Ngamdee K, Surawanitkun C, Ren XK, Ngeontae W. A portable fluorescence detection device based on a smartphone employing carbon nanodots for Mn(2 + ) sensing. Anal Methods 2024; 16(14):2101-10. doi: 10.1039/d4ay00027g [Crossref] [ Google Scholar]
- Ponlakhet K, Phooplub K, Phongsanam N, Phongsraphang T, Phetduang S, Surawanitkun C. Smartphone-based portable fluorescence sensor with gold nanoparticle mediation for selective detection of nitrite ions. Food Chem 2022; 384:132478. doi: 10.1016/j.foodchem.2022.132478 [Crossref] [ Google Scholar]
- The United States Pharmacopoeia Convention. The United States Pharmacopoeia, 43th Revision, The National Formulary. 38th ed. Rockville: United Book Press, Inc; 2020.
- The British Pharmacopoeia Commission. British Pharmacopoeia 2022. London: The Stationery Office; 2022.
- Siddiqui FA, Arayne MS, Sultana N, Qureshi F, Mirza AZ, Zuberi MH. Spectrophotometric determination of gabapentin in pharmaceutical formulations using ninhydrin and pi-acceptors. Eur J Med Chem 2010; 45(7):2761-7. doi: 10.1016/j.ejmech.2010.02.058 [Crossref] [ Google Scholar]
- Effendi N, Kosman R, Passuke A, Naid T. Validated UV-Vis spectrophotometric method for determination of gabapentin using acetyl acetone and formaldehyde reagents: validated spectrophotometric method for determination of gabapentin. Iran J Pharm Sci 2013; 9(2):23-9. doi: 10.22037/ijps.v9.40893 [Crossref] [ Google Scholar]
- Abdulrahman SA, Basavaiah K. Sensitive and selective spectrophotometric determination of gabapentin in capsules using two nitrophenols as chromogenic agents. Int J Anal Chem 2011; 2011:619310. doi: 10.1155/2011/619310 [Crossref] [ Google Scholar]
- Winotapun W, Kongpakwattana K, Dejpittayanunt S, Pathomcharoensukchai S, Suksaran U, Nuntharatanapong N. “From safe source to safe sink” development of colorimetric assay for gabapentin in bulk drug and capsules using naturally derived genipin. Talanta 2012; 99:997-1003. doi: 10.1016/j.talanta.2012.07.084 [Crossref] [ Google Scholar]
- Belal F, Abdine H, Al-Majed A, Khalil NY. Spectrofluorimetric determination of vigabatrin and gabapentin in urine and dosage forms through derivatization with fluorescamine. J Pharm Biomed Anal 2002; 27(1-2):253-60. doi: 10.1016/s0731-7085(01)00503-9 [Crossref] [ Google Scholar]
- Sekar R, Azhaguvel S. Indirect photometric assay determination of gabapentin in bulk drug and capsules by capillary electrophoresis. J Pharm Biomed Anal 2004; 36(3):663-7. doi: 10.1016/j.jpba.2004.07.033 [Crossref] [ Google Scholar]
- El-Tohamy M, Razeq S, Shalaby A. Electrochemical sensors for determination of anticonvulsant drug gabapentin in bulk powder and pharmaceutical dosage forms. Int J Electrochem Sci 2012; 7(6):5374-87. doi: 10.1016/s1452-3981(23)19628-3 [Crossref] [ Google Scholar]
- Derayea SM, Samir E. A review on the use of fluorescamine as versatile and convenient analytical probe. Microchem J 2020; 156:104835. doi: 10.1016/j.microc.2020.104835 [Crossref] [ Google Scholar]
- Phadungcharoen N, Patrojanasophon P, Opanasopit P, Ngawhirunpat T, Chinsriwongkul A, Rojanarata T. Smartphone-based Ellman’s colourimetric methods for the analysis of D-penicillamine formulation and thiolated polymer. Int J Pharm 2019; 558:120-7. doi: 10.1016/j.ijpharm.2018.12.078 [Crossref] [ Google Scholar]
- Hu LM, Luo K, Xia J, Xu GM, Wu CH, Han JJ. Advantages of time-resolved fluorescent nanobeads compared with fluorescent submicrospheres, quantum dots, and colloidal gold as label in lateral flow assays for detection of ractopamine. Biosens Bioelectron 2017; 91:95-103. doi: 10.1016/j.bios.2016.12.030 [Crossref] [ Google Scholar]
- Wu Z, Xu E, Chughtai MFJ, Jin Z, Irudayaraj J. Highly sensitive fluorescence sensing of zearalenone using a novel aptasensor based on upconverting nanoparticles. Food Chem 2017; 230:673-80. doi: 10.1016/j.foodchem.2017.03.100 [Crossref] [ Google Scholar]
- Farshchi F, Saadati A, Kholafazad Kordasht H, Hasanzadeh M. An innovative immunoanalysis strategy towards sensitive recognition of PSA biomarker in human plasma samples using flexible and portable paper-based biosensor: a new platform towards POC detection of cancer biomarkers using integration of pen-on paper technology with immunoassays methods. ImmunoAnalysis 2021; 1(1):6. doi: 10.34172/ia.2021.06 [Crossref] [ Google Scholar]
- Mansouri M, Fathi F, Jalili R, Shoeibie S, Dastmalchi S, Khataee A. SPR enhanced DNA biosensor for sensitive detection of donkey meat adulteration. Food Chem 2020; 331:127163. doi: 10.1016/j.foodchem.2020.127163 [Crossref] [ Google Scholar]
- Shayanfar A. A critical issue in calibration curve with logarithmic scale. ImmunoAnalysis 2021; 1(1):9. doi: 10.34172/ia.2021.09 [Crossref] [ Google Scholar]
- Urban PL. Please avoid plotting analytical response against logarithm of concentration. Anal Chem 2020; 92(15):10210-2. doi: 10.1021/acs.analchem.0c02096 [Crossref] [ Google Scholar]
- Kong D, Zhao J, Tang S, Shen W, Lee HK. Logarithmic data processing can be used justifiably in the plotting of a calibration curve. Anal Chem 2021; 93(36):12156-61. doi: 10.1021/acs.analchem.1c02011 [Crossref] [ Google Scholar]
- Hong Q, Shen Y, Liu S, Zhang Y. Re-examination of plotting analytical response against different forms of concentration. Anal Chem 2021; 93(35):11910-4. doi: 10.1021/acs.analchem.1c02683 [Crossref] [ Google Scholar]
- Abdulrahman SA, Basavaiah K. Sensitive and selective spectrophotometric assay of gabapentin in capsules using sodium 1, 2-naphthoquinone-4-sulfonate. Drug Test Anal 2011; 3(10):748-54. doi: 10.1002/dta.242 [Crossref] [ Google Scholar]
- Udaykumar Rao B, Maqdoom F, Pratima Nikalje AN. Determination of gabapentin in bulk drug and in pharmaceutical dosage form by HPLC method. J Chil Chem Soc 2009; 54(4):424-7. doi: 10.4067/s0717-97072009000400022 [Crossref] [ Google Scholar]
- Płotka-Wasylka J. A new tool for the evaluation of the analytical procedure: green analytical procedure index. Talanta 2018; 181:204-9. doi: 10.1016/j.talanta.2018.01.013 [Crossref] [ Google Scholar]
- Pena-Pereira F, Wojnowski W, Tobiszewski M. Agree-analytical greenness metric approach and software. Anal Chem 2020; 92(14):10076-82. doi: 10.1021/acs.analchem.0c01887 [Crossref] [ Google Scholar]
- Manousi N, Wojnowski W, Płotka-Wasylka J, Samanidou V. Blue applicability grade index (BAGI) and software: a new tool for the evaluation of method practicality. Green Chem 2023; 25(19):7598-604. doi: 10.1039/d3gc02347h [Crossref] [ Google Scholar]
- Kepekci Tekkeli SE, Önal A, Sağırlı AO. Spectrofluorimetric determination of tobramycin in human serum and pharmaceutical preparations by derivatization with fluorescamine. Luminescence 2014; 29(1):87-91. doi: 10.1002/bio.2507 [Crossref] [ Google Scholar]
- Darwish IA, Khalil NY, Bakheit AH, Alzoman NZ. A highly sensitive fluorimetric method for determination of lenalidomide in its bulk form and capsules via derivatization with fluorescamine. Chem Cent J 2012; 6(1):118. doi: 10.1186/1752-153x-6-118 [Crossref] [ Google Scholar]
- Segura Carretero A, Cruces-Blanco C, Fernández Peinado S, El Bergmi R, Fernández Gutiérrez A. Fluorimetric determination of procaine in pharmaceutical preparations based on its reaction with fluorescamine. J Pharm Biomed Anal 1999; 21(5):969-74. doi: 10.1016/s0731-7085(99)00222-8 [Crossref] [ Google Scholar]
- Caglar Andac S, Önal A, Toker S. Determination of sitagliptin with fluorescamine in tablets and spiked serum samples by spectrofluorimetry and a degradation study. Curr Pharm Anal 2012; 8(3):278-85. doi: 10.2174/157341212801619270 [Crossref] [ Google Scholar]