Pharmaceutical Sciences. 2025;31(3):261-269.
doi: 10.34172/PS.025.40838
Research Article
Solubility of Sildenafil Citrate in Polyethylene Glycol 200+Water Mixtures at 293.2-313.2 K
Homa Rezaei Data curation, Funding acquisition, Investigation, Methodology, Validation, Writing – original draft, 1 
Abolghasem Jouyban Conceptualization, Project administration, Supervision, Writing – review & editing, 2, *
Author information:
1Student Research Committee, Faculty of Pharmacy, Tabriz University of Medical Sciences, Tabriz, Iran
2Pharmaceutical Analysis Research Center and Faculty of Pharmacy, Tabriz University of Medical Sciences, Tabriz, Iran
Abstract
Background:
In the current investigation, the evaluation of model congruence alongside experimental determinations of the solid-liquid phase boundary concerning sildenafil citrate (SICI) within aqueous binary blends of polyethylene glycol 200 has been conducted.
Methods:
Solubility values were measured using a classical method of Shake-flask at various temperatures.
Results:
It was observed that the dissolution profile of SICI in the specified binary media demonstrated a positive thermal coefficient. For the determined solubility data, mathematical cosolvency models were employed for the fitting and prediction tasks, showcasing a commendable capability in forecasting the solubility patterns of SICI in the aqueous solutions of polyethylene glycol 200. In addition, apparent thermodynamic quantities pertaining to the dissolution of SICI were computed utilizing both Gibbs and van’t Hoff equations, facilitating an in-depth comprehension of the solubilization phenomena within the studied solvents.
Conclusion:
The insights gleaned from the rigorous interrogation and validation of the solubility for SICI promise to enhance crystallization methodologies, scale-up production, and pharmaceutical formulation studies.
Keywords: Sildenafil citrate, Solubility, PEG 200, Binary solvent mixtures, Jouyban-Acree model
Copyright and License Information
© 2025 The Author(s).
This is an open access article and applies the Creative Commons Attribution Non-Commercial License (
http://creativecommons.org/licenses/by-nc/4.0/). Non-commercial uses of the work are permitted, provided the original work is properly cited.
Funding Statement
The research was supported by the Student Research Committee, Tabriz University of Medical Sciences, Tabriz, Iran under grant number 67716.
Introduction
Sildenafil (Figure 1) is prescribed for the therapeutic management of pulmonary arterial hypertension and erectile dysfunction which exerts the therapeutic effects by selectively inhibiting phosphodiesterase 5 (PDE5).1,2 When dealing with pharmaceutical compounds that encompass ionizable groups, pharmacists encounter an opportunity to selectively produce a salt form that offers improved biopharmaceutical characteristics, such as increased maximum plasma concentration (Cmax), reduced time to reach Cmax (Tmax), and enhanced area under the curve (AUC).3 Sildenafil is typically recommended for oral administration and is commercially available as citrate salt. The assessment of a drug’s solubility characteristics in both aqueous and non-aqueous solvents remains a pivotal aspect within various industrial applications, encompassing purification procedures, the formulation design of oral/parenteral/topical liquid pharmaceutical forms, and pre-formulation investigations.4,5 Jung et al4,5 reported the solubility of sildenafil and its citrate and lactate salts in water, ethanol, polyethylene glycol (PEG) 400, Transcutol and Tween 20. The aqueous solubility of sildenafil (molecular mass of 474.6 g/mole) was 14.5 µg/mL (or 3.1 × 10⁻⁵ molar) which was increased to 4100 µg/mL (or 6.0 × 10⁻³ molar) for citrate salt and 92 500 µg/mL (or 0.164 molar) for lactate salt. In addition to increased aqueous solubility, the plasma concentration of lactate salt was greater than that of citrate form and it was greater than of base form of sildenafil.4,5
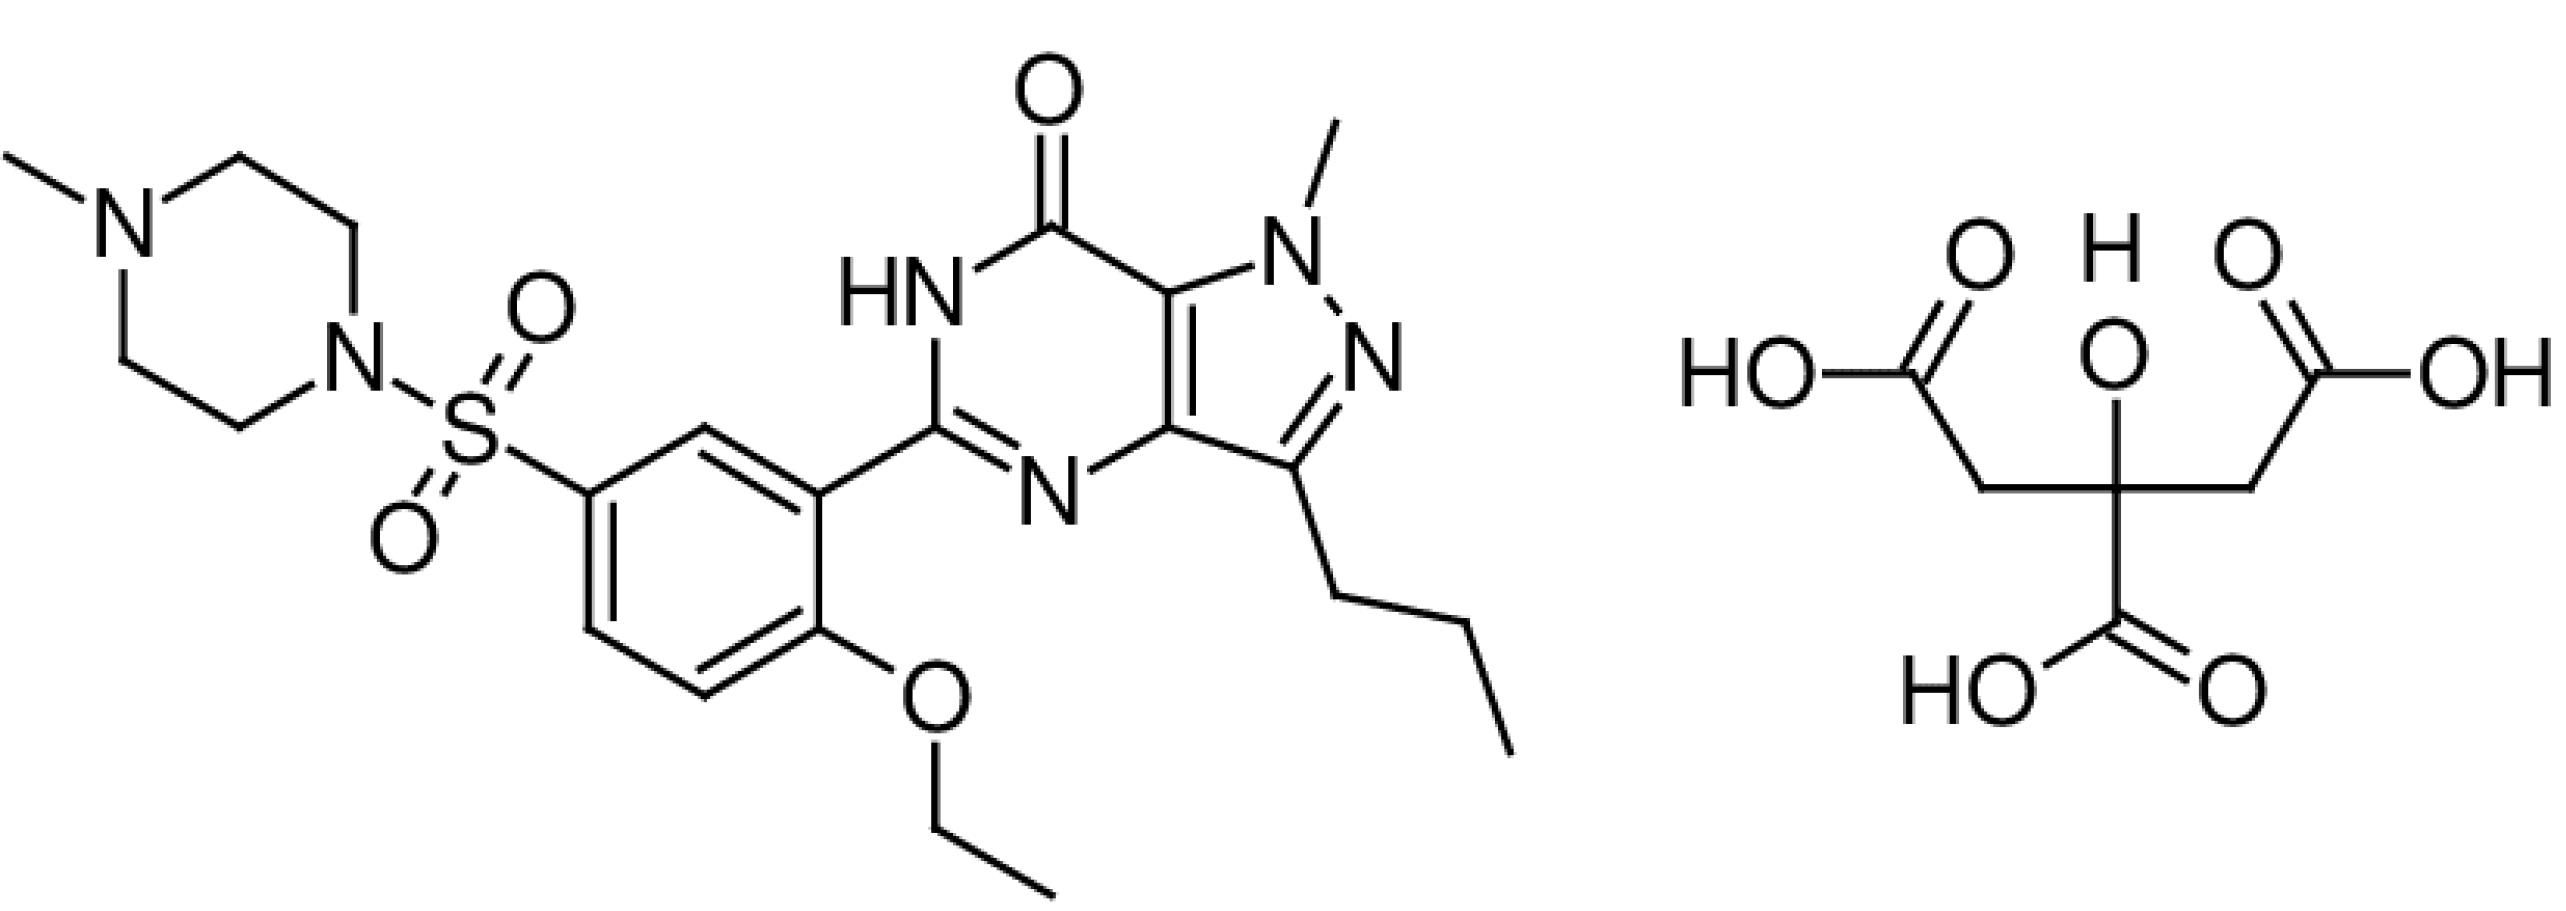
Figure 1.
Molecular structure of sildenafil citrate
.
Molecular structure of sildenafil citrate
Moreover, the investigation of drugs’ solubility within organic solvents offers valuable insights for a spectrum of applications including purification processes, analytical chemistry, validation of cleaning procedures, manufacturing, process development, and solid forms screening, encompassing salt forms, cocrystals, and polymorphic variations.3 Many strategies have been devised throughout the years to quantify solubility6,7 and among these approaches, cosolvency has gained substantial utilization within the domain of pharmaceutical science and practice.8,9
Previous research has explored the solubility of sildenafil citrate (SICI) in various mono-solvent systems including ethanol as reported by Jung and co-workers,10 and in other mono-solvents such as toluene, 1,2-dichloroethane, hexane, and 1-butanol, as studied by Baluja and Bhesaniya.11 Additionally, our group has examined its solubility within certain aqueous binary cosolvent systems containing PEG 400, ethanol (EtOH), propylene glycol (PG), ethylene glycol (EG), 1-propanol, 2-propanol and non-aqueous binary mixtures of PG + EtOH. In addition to the reported solubility data of SICI in common mono- or mixed solvent systems, the solubility was investigated in supercritical carbon dioxide at various temperatures and pressures.12 Deep eutectic solvents are recently developed materials with a wide range of applications in the pharmaceutical area13 and attracted more attentions. Solubility of SICI was also reported in deep eutectic solvent + water mixtures at various temperatures.14 However, to our current knowledge, the literature does not encompass data pertaining to the solubility of SICI in a solvent system comprised of PEG 200 and water. The objective of this study is to compile a solubility compendium for SICI within cosolvency systems. The specific aims include: (1) ascertaining the solubility data of SICI saturated in solutions comprising PEG 200 and water across a temperature spectrum of 293.2 to 313.2 K along with their density values; (2) engaging in the comparative analysis of the acquired data with established cosolvency models in the literature; (3) deducing the apparent thermodynamic quantities that characterize the dissolution process of SICI within the cosolvent mixtures under investigation, (4) providing prediction methods based on mathematical models trained using a minimum number of experimental data points, and (5) providing density prediction method for SICI saturated solution in the mixed solvents at various temperature.
Materials and Methods
The solvent of organic nature requisitioned for the conductance of measurements, delineated as PEG 200, adhered to the stringent analytical-grade requisites. Concomitantly, distilled water, prepared within the laboratory setting, was utilized for the dilution of the saturated solutions. The purification level of the experimental reagents surpassed a 99.0% threshold, thereby negating the necessity for additional purification. The parameters encompassing purity, provenance, methodologies of analysis, along with other exhaustive specifications pertinent to the materials implemented throughout the experimental sequence, are shown in Table 1.
Table 1.
Information of substances used in the work ahead
|
Chemical name
|
CAS No.
|
Molar mass (g.mole1-) |
Source
|
Purity (percentage)
|
Analysis method
|
| Sildenafil citrate |
171599-83-0 |
666.7 |
Damavand Darou Pharmaceutical Co. Iran |
≥ 99.7 % |
HPLCa |
| PEG 200 |
25322-68-3 |
190 - 210 |
Merck, Germany |
≥ 99.8 % |
GCb |
| Distilled deionized water |
7732-18-5 |
18.02 |
Shahid Ghazi Pharmaceutical Co. Iran |
≥ 99.9 % |
GCb |
| Ethanol |
64-17-5 |
46.07 |
Jahan Alcohol Teb, Iran |
≥ 93.5 % |
GCb |
aHigh-performance liquid chromatography.
bGas chromatography.
Measurement of SICI solubility
In an experimental setup designed for the quantitative dissolution analysis of SICI, the solid-liquid phase equilibrium was delineated utilizing a mixed solvent system comprising PEG 200 and water. The equilibrium solubility was quantified via ultraviolet-visible (UV-vis) spectrophotometry. This protocol adheres to methodologies established in prior researches.15-17 Specifically, eleven dry glass vials were prepared, each containing a binary solvent mixture of water and PEG 200. The mass ratio of PEG 200 was varied from 0.0 to 1.0. Subsequently, an excess quantity of SICI was introduced into these solvent systems. The vials were then placed in an incubator (Kimia Idea Pardaz Azerbaijan, Tabriz, Iran) and subjected to agitation for 48 hours using a shaker (Behdad, Tehran, Iran). Post-equilibrium, the supernatant underwent centrifugation. A measured volume of the saturated supernatant solution was taken and subsequently diluted with a solvent mixture (ethanol: water, 30:70) for analytical purposes. The dilutions were then scrutinized using a UV-vis spectrophotometer (Cecil BioAquarius CE 7250, UK) at a wavelength of 294 nm. Calibration was achieved through the preparation of standard SICI solutions within the concentration range of 1 × 10⁻⁵ to 1.8 × 10⁻⁴ M, exhibiting a linear relationship with a squared correlation coefficient (R2) of 0.9995. Experimental temperatures were maintained between 293.2 K and 313.2 K, with 5 K increments. The density values of the SICI saturated mixtures were determined using a 5 mL pycnometer, with a measurement uncertainty of 0.001 g∙cm-3.
Computational section
The solubility data gathered experimentally are integrated with a suite of computational models, namely double log-log, Jouyban-Acree, and Jouyban-Acree-van’t Hoff models. These models are adept at delineating the interplay among temperature, solubility, and the initial composition of the solvent. Expository details on each model are delineated in successive sections. Back-calculated data are derived in accordance with Eq. (1) to facilitate the appraisal of each model’s precision. This is achieved by computing the mean relative deviation (MRD%) via Eq. (1):
(1)
in this context, N denotes the total number of solubility/density data points.
In addition, predicted solubility of SICI in mono-solvents and mixed solvents at various temperatures are provided using mathematical models trained by using a minimum number of experimental data points.
Double log-log
The double log-log model represents a cosolvency framework for the empirical fitting of solubility data, encapsulated by the following mathematical expressions18:
(2)
for 0 < w1 ≤ 0.5
(3)
for 0 < w2 ≤ 0.5
within these formulations, x1 and x2 represent the mole fraction solubility of drug in solvent 1 and 2, respectively, and (xm)0.5 represents the drug solubility in solvent mixtures with a cosolvent mass fraction of 0.5. The mass fractions w1 and w2 quantify the proportions of mono-solvents 1 and 2 in the mixture prior to the addition of the solute. The constants B and b are model-specific parameters intrinsic to the equations. Eq. (2) governs the scenario where the mass fraction of the mono-solvent 1 is in the range of 0 < w1 ≤ 0.5, while Eq. (3) applies analogously to the mass fraction of the mono-solvent 2 within the same interval (0 < w2 ≤ 0.5). Barzegar-Jalali and Hanaee18 used the volume fraction expression of the solvents in their work, however one may use other expressions such as mass or mole fraction units as has been shown in this work.
The Jouyban-Acree model
The Jouyban-Acree model, acknowledged as a linear mathematical algorithm, explicates the solubility as a function contingent upon both the system’s temperature and the solvent composition. The model is19:
(4)
Herein, x1,T and x2,T denote the solubility values in the respective mono-solvents at the temperature T, the Ji coefficients are the model parameters achieved by linear regression of
against
, and
.
The Jouyban-Acree model is particularly esteemed for its incorporation of interaction parameters that describe the non-ideal behavior of the mixtures, which is especially relevant in pharmaceutical solutions where precise solubility predictions are vital for dosage form design and other industrial applications. The model is robust in its adaptability to various solvent systems and temperatures, making it a versatile tool in the prediction of drug solubility across a spectrum of conditions. An adopted version of the Jouyban-Acree model could be used for mathematical representation of the density of the drug free and also saturated solutions at various temperatures.19
The Jouyban-Acree-van’t Hoff model
By replacing the van’t Hoff equation within the two first terms of the Jouyban-Acree model, a precise methodology for the simulation of solubility within cosolvency systems could be obtained.19 The Jouyban-Acree-van’t Hoff model is formulated as:
(5)
In this expression, A1, B1, A2 and B2 are the constants of the van’t Hoff model, derived from plotting the natural logarithm of the solubility in mono-solvents, x1,T and x2,T against the reciprocal of the temperature, 1/T in the mono-solvents across various temperatures. Ji coefficients are ascertained via linear regression analysis of
.
The modified Wilson model
The modified Wilson model is formulated as:
(6)
where, λ12 and λ21 are the interaction parameters of the equation, computed using a non-linear regression analysis.20
Thermodynamic parameters
In the investigation of SICI’s dissolution behavior, thermodynamic functions of mixing, namely the apparent standard dissolution Gibbs energy (ΔG°), standard dissolution enthalpy (ΔH°) and standard dissolution entropy change (ΔS°) are utilized. These apparent thermodynamic parameters are deduced by applying both the Gibbs equation and the modified van’t Hoff equation. The latter is expressed as follows:
In this context, x represents the mole fraction solubility of the solute, R is the ideal gas constant, and T stands for the absolute temperature in Kelvin.21 The symbol Thm refers to the mean harmonic temperature, calculated based on the number of temperature points studied, denoted by n, according to
. The slope and the intercept of the plot of ln x vs 1/T − 1/Thm are used to obtain
for saturated mixtures, and
values are calculated by using Gibbs equation.
In the thermodynamic analysis of binary solvent mixtures, the relative magnitudes of entropy (ζTS) and enthalpy (ζH) contributions to the dissolution processes are quantitatively assessed. The expressions for these indices are formulated as22:
Results and Discussion
Solubility profile of SICI and data correlation
The solubility profile of SICI in molar concentration unit in aqueous binary mixtures containing PEG 200 is graphically represented as a function of the solvent’s mass fraction and temperature in Figure 2. Thermodynamic principles suggest that solubility should be positively influenced by temperature due to the enhancement of molecular kinetics and the expansion of intermolecular spacing within the solvent matrix, a phenomenon that is empirically corroborated by the data presented in Figure 2. It is discernible that a direct, proportional relationship exists between the molar solubility of SICI and both temperature and the mass fraction of PEG 200 within fixed solvent compositions, culminating in peak solubility at a PEG 200 mass fraction of 0.7, beyond which an inverse trend is observed. Figure 3 illustrates the dissolution dynamics of SICI, expressed in mole fraction, in binary solvent systems of PEG 200 and water, delineated across temperature and solvent composition gradients. The solubility pattern delineated therein reaffirms the positive correlation with both thermal conditions and PEG 200 mass fraction, with maximal solubility being attained in neat PEG 200. When the mole fraction solubility of SICI in neat PEG 200 was compared with the solubility in neat PEG 400,23 the solubility in PEG 400 is larger than in PEG 200 at a given temperature. This observation is also the case for the solubility of mesalazine,24 bosentan25 and etoricoxib26 in which the solubility order is as PEG 600 > PEG 400 > PEG 200. Slightly different pattern is observed for salicylic acid as PEG 600 > PEG 200 > PEG 400.27
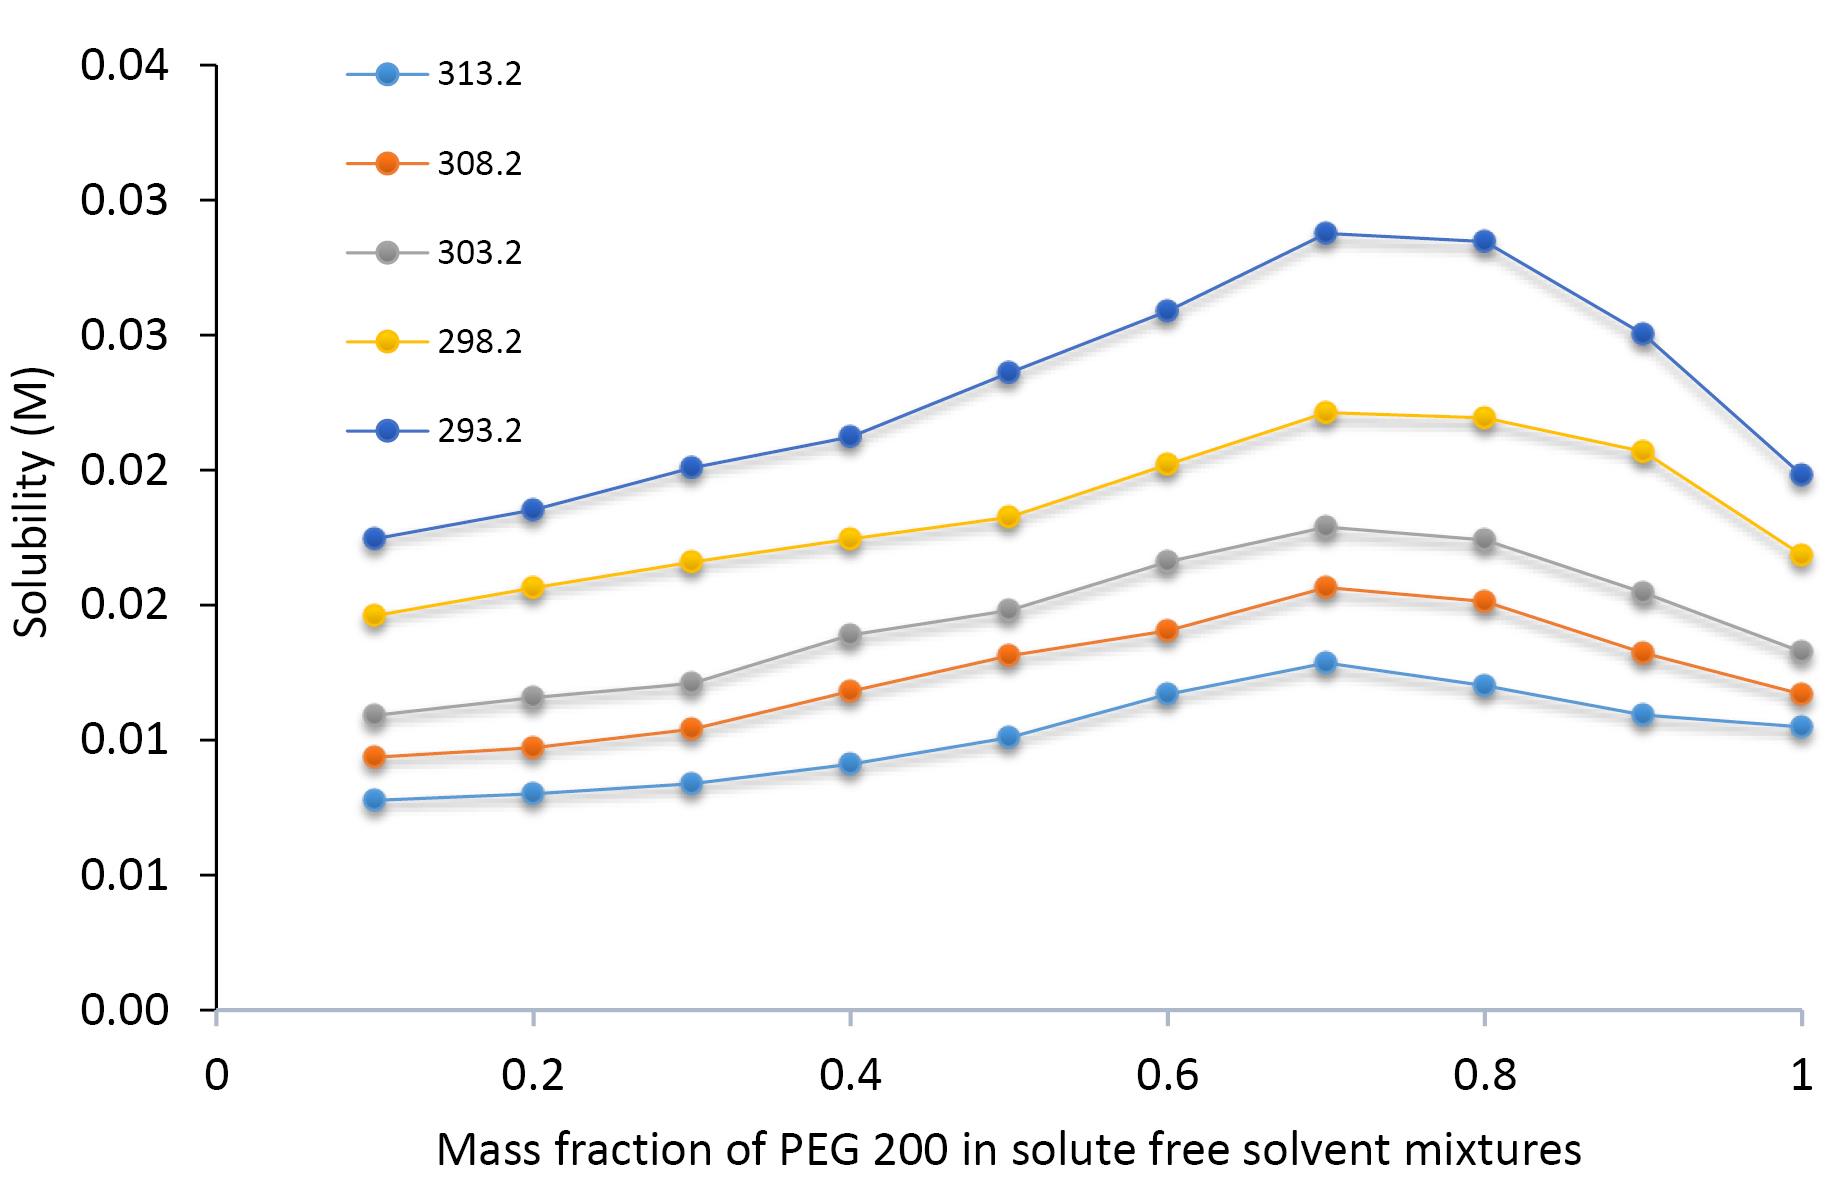
Figure 2.
Molar solubility of sildenafil citrate in systems of PEG 200 + water as a function of the mass fraction of PEG 200 and temperature 293.2 K (bottom) to 313.2 K (top)
.
Molar solubility of sildenafil citrate in systems of PEG 200 + water as a function of the mass fraction of PEG 200 and temperature 293.2 K (bottom) to 313.2 K (top)
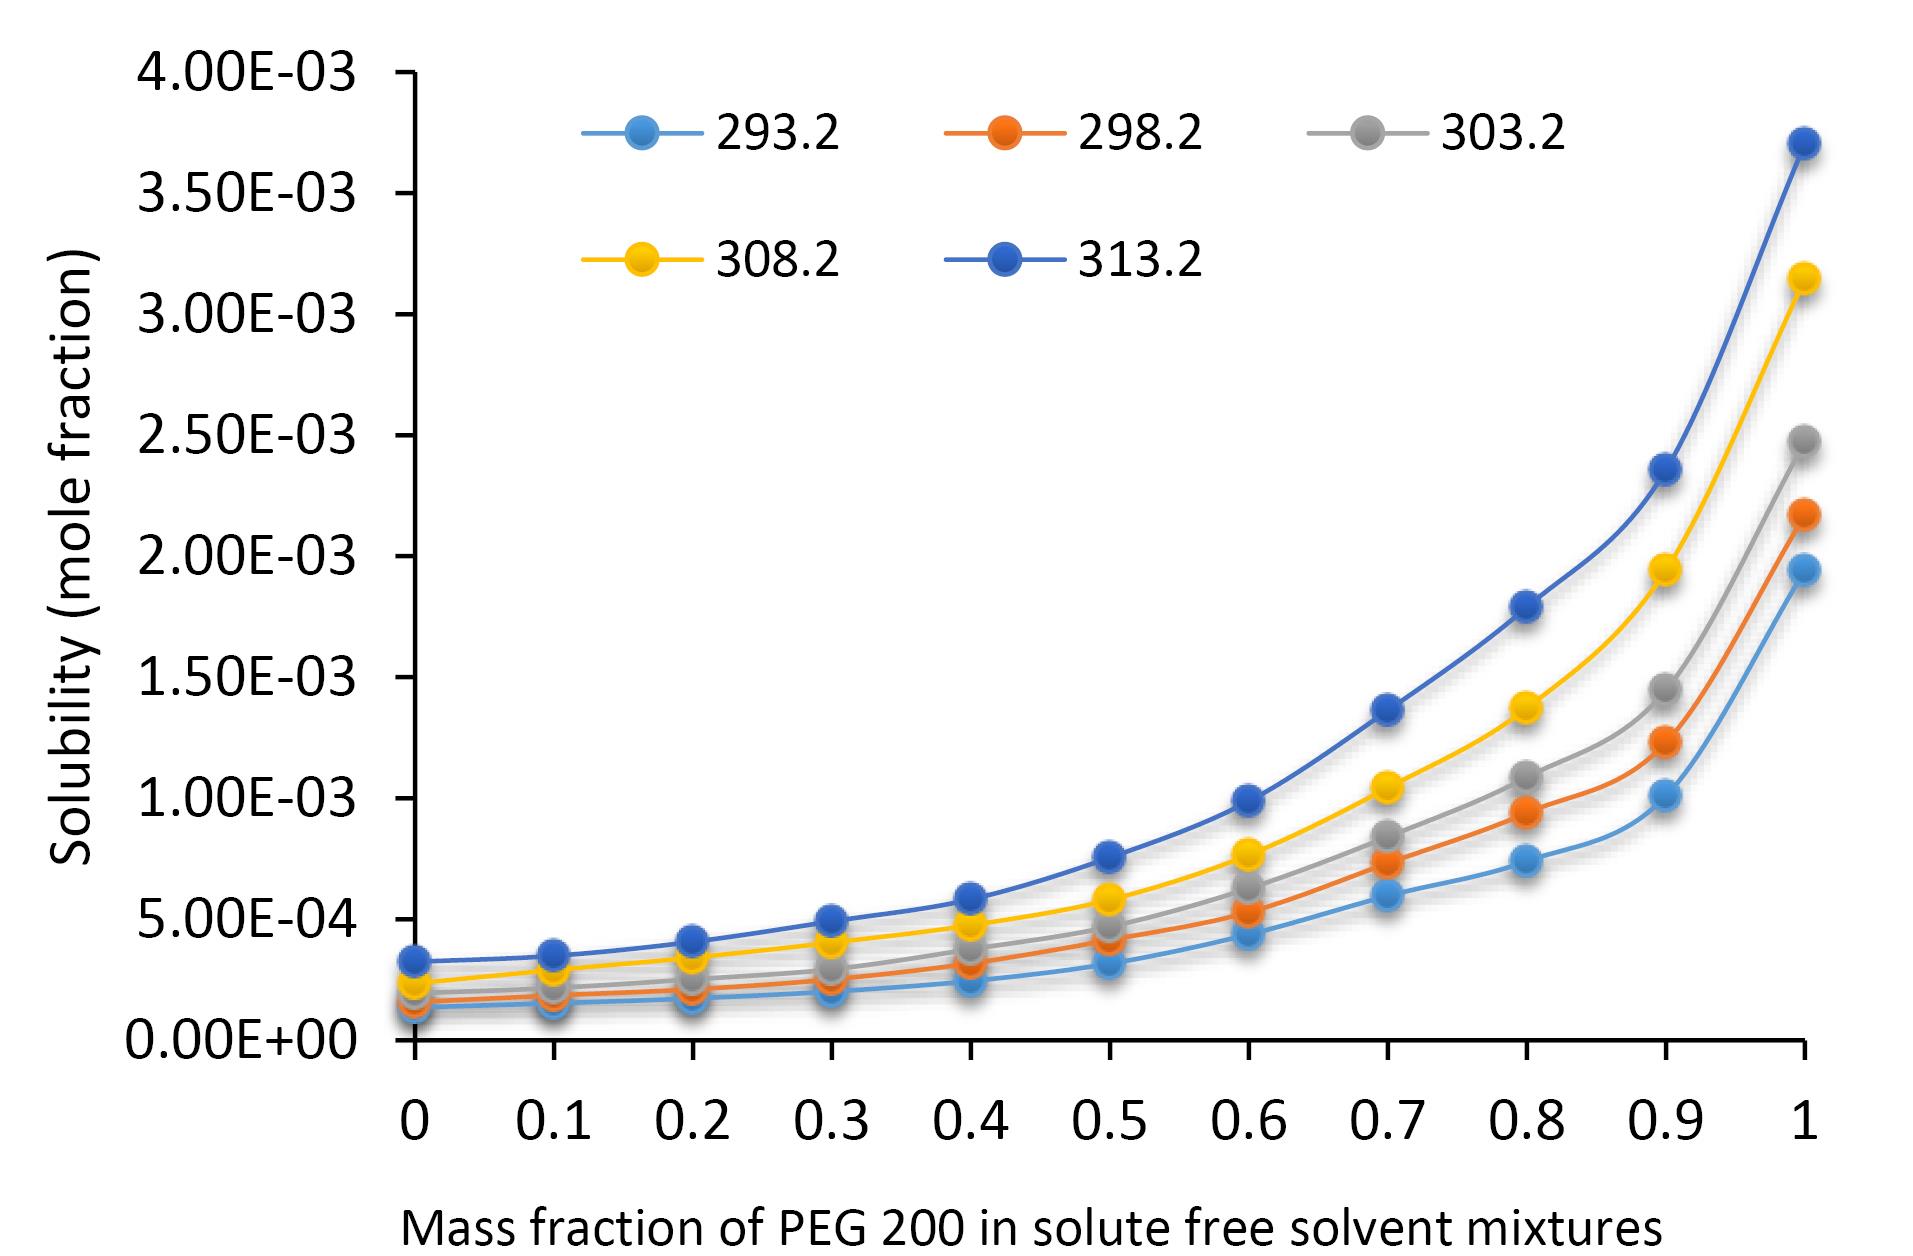
Figure 3.
Mole fraction solubility of sildenafil citrate in systems of PEG 200 + water as a function of the mass fraction of PEG 200 and temperature
.
Mole fraction solubility of sildenafil citrate in systems of PEG 200 + water as a function of the mass fraction of PEG 200 and temperature
The experimental mole fraction solubility data of SICI in aqueous binary mixtures with PEG 200 (Table 2) were subjected to fitting using four distinct cosolvency models: the modified Wilson, double log-log, Jouyban-Acree, and Jouyban-Acree-van’t Hoff. The outcomes of these fittings are systematically documented in Tables 3-5. A concise assessment reveals that the solubility predictions made by all four cosolvency models are deemed satisfactory for SICI in the specified solvent mixtures. Among these, the double log-log model exhibited superior precision, evidenced by the lowest MRD% of 2.4%. The double log-log as a pure empirical model uses logarithmic transformations for linearization of the solubility values against logarithm of solvent fractions in the absence of the solute. It could provide a simple and straightforward predictive tool for a drug formulator. In the pharmaceutical applications of the solubility data in cosolvent + water mixtures, there is a limitation of the cosolvent concentration in the final formulation due to possible toxicity of the cosolvent and also cost of the formulation since the price of the cosolvent is much more than water. Therefore, Eq. (2) is capable of providing useful information for pharmaceutical applications at w1 ≤ 0.5. The MRD% values for the remaining models are sequenced as follows: the modified Wilson (3.0%) < the Jouyban-Acree (3.5%) < Jouyban-Acree-van’t Hoff (4.3%). From a practical viewpoint, the MRD%s for all studied models are less than the relative standard deviations for the repeated solubility measurements28 and all the models could be considered as accurate models for correlative purposes.
Table 2.
Experimental mole fraction solubility (xm,T) values as the mean of three experiments ( ± standard deviation) measured for sildenafil citrate in the binary mixtures of PEG 200 and water at different temperatures.
|
w1a
|
293.2 K
|
298.2 K
|
303.2 K
|
308.2 K
|
313.2 K
|
| 0.00b |
1.36 ( ± 0.05) × 10–4 |
1.58 ( ± 0.03) × 10–4 |
1.94 ( ± 0.04) × 10–4 |
2.35 ( ± 0.14) × 10–4 |
3.24 ( ± 0.36) × 10–4 |
| 0.10 |
1.53 ( ± 0.03) × 10–4 |
1.85 ( ± 0.13) × 10-4 |
2.16 ( ± 0.11) × 10–4 |
2.90 ( ± 0.02) × 10–4 |
3.49 ( ± 0.14) × 10–4 |
| 0.20 |
1.73 ( ± 0.00) × 10–4 |
2.11 ( ± 0.18) × 10–4 |
2.52 ( ± 0.04) × 10–4 |
3.42 ( ± 0.06) × 10–4 |
4.07 ( ± 0.18) × 10–4 |
| 0.30 |
2.02 ( ± 0.29) × 10–4 |
2.52 ( ± 0.13) × 10–4 |
2.94 ( ± 0.04) × 10–4 |
4.04 ( ± 0.08) × 10–4 |
4.92 ( ± 0.23) × 10–4 |
| 0.40 |
2.45 ( ± 0.15) × 10–4 |
3.18 ( ± 0.09) × 10–4 |
3.76 ( ± 0.57) × 10–4 |
4.76 ( ± 0.66) × 10–4 |
5.83 ( ± 0.62) × 10–4 |
| 0.50 |
3.17 ( ± 0.04) × 10–4 |
4.15 ( ± 0.03) × 10–4 |
4.70 ( ± 0.31) × 10–4 |
5.81 ( ± 0.11) × 10–4 |
7.55 ( ± 0.47) × 10–4 |
| 0.60 |
4.37 ( ± 0.02) × 10–4 |
5.29 ( ± 0.04) × 10–4 |
6.28 ( ± 0.52) × 10–4 |
7.66 ( ± 0.19) × 10–4 |
9.88 ( ± 1.22) × 10–4 |
| 0.70 |
5.97 ( ± 0.06) × 10–4 |
7.32 ( ± 0.54) × 10–4 |
8.41 ( ± 0.34) × 10–4 |
1.04 ( ± 0.01) × 10–3 |
1.36 ( ± 0.07) × 10–3 |
| 0.80 |
7.40 ( ± 0.84) × 10–4 |
9.40 ( ± 0.24) × 10–4 |
1.09 ( ± 0.02) × 10–3 |
1.37 ( ± 0.01) × 10–3 |
1.79 ( ± 0.25) × 10–3 |
| 0.90 |
1.01 ( ± 0.09) × 10–3 |
1.23 ( ± 0.02) × 10–3 |
1.45 ( ± 0.10) × 10–3 |
1.94 ( ± 0.20) × 10–3 |
2.36 ( ± 0.10) × 10–3 |
| 1.00 |
1.94 ( ± 0.21) × 10–3 |
2.17 ( ± 0.19) × 10–3 |
2.47 ( ± 0.02) × 10–3 |
3.15 ( ± 0.15) × 10–3 |
3.70 ( ± 0.02) × 10–3 |
a w1 is mass fraction of PEG 200 in the PEG 200 and water mixtures in the absence of sildenafil citrate.
b The aqueous solubility data taken from a previous work.15,16
Table 3.
The double log-log model constants at investigated temperatures and the MRD% for back-calculated sildenafil citrate solubility in the binary mixtures of PEG 200 and water
|
T (K)
|
B for 0<w1≤0.5
|
MRD%
|
b for 0<w2≤0.5
|
MRD%
|
| 293.2 |
0.900 |
3.3 |
0.664 |
2.6 |
| 298.2 |
0.838 |
1.1 |
0.694 |
1.0 |
| 303.2 |
0.928 |
2.2 |
0.733 |
3.8 |
| 308.2 |
0.650 |
0.9 |
0.779 |
3.5 |
| 313.2 |
1.036 |
0.1 |
0.809 |
5.7 |
| Overall MRD% |
1.5 |
|
3.3 |
Table 4.
Parameters calculated for the Jouyban-Acree, and Jouyban-Acree-van’t Hoff model for sildenafil citrate solubility in the binary mixtures of PEG 200 and water.
|
|
Jouyban-Acree
|
Jouyban-Acree-van’t Hoff
|
| PEG 200 + water |
J0
|
-456.631 |
A1
|
4.113 |
|
|
J1
|
-121.249 |
B1
|
-3048.916 |
|
|
J2
|
-245.791 |
A2
|
4.374 |
|
|
|
|
B2
|
-3907.015 |
|
|
|
|
J0
|
-456.571 |
|
|
|
|
J1
|
-121.341 |
|
|
|
|
J2
|
245.640 |
|
MRD% |
3.5 |
4.3 |
Table 5.
The modified Wilson model constants at investigated temperatures and the MRD% for back-calculated sildenafil citrate solubility in the binary mixtures of PEG 200 and water
|
T (K)
|
λ12
|
λ21
|
MRD%
|
| 293.2 |
2.163 |
0.462 |
4.4 |
| 298.2 |
1.820 |
0.549 |
3.1 |
| 303.2 |
1.221 |
0.708 |
3.0 |
| 308.2 |
1.789 |
0.559 |
2.6 |
| 313.2 |
0.791 |
0.940 |
1.9 |
| Overall MRD% |
|
3.0 |
The solubility of a solute could be expressed using various units including mole fraction, molarity (Table S1) and gram per liter. The solvent composition of the binary solvents could also be expressed using mole fraction, mass fraction and volume fraction (see Table S2 of Supplementary file 1). By fitting the data with various units, different values were obtained for the constants of the Jouyban-Acree model, however, no significant difference was observed in MRD% values as shown in Table S3 (see Supplementary file 1). Different model constants are due to the various curvature and scattering the data as shown in Figures S1-S3 (see Supplementary file 1).
Density data of SICI and correlation
The densities of SICI’s saturated solutions in the binary aqueous mixtures with PEG 200, measured across a range of temperatures, are tabulated in Table 6, expressed in g.cm–3. The generated density data could be modeled by an adopted version of the Jouyban-Acree model29 as:
Table 6.
Measured density (g.cm–3) of sildenafil citrate saturated solutions in the binary mixtures of PEG 200 and water at different temperatures
|
w
1
|
293.2 K
|
298.2 K
|
303.2 K
|
308.2 K
|
313.2 K
|
| 0.00 |
0.998 ± 0.001 |
0.997 ± 0.001 |
0.996 ± 0.001 |
0.995 ± 0.001 |
0.995 ± 0.001 |
| 0.10 |
1.009 ± 0.001 |
1.007 ± 0.001 |
1.006 ± 0.001 |
1.006 ± 0.001 |
1.001 ± 0.001 |
| 0.20 |
1.022 ± 0.001 |
1.021 ± 0.001 |
1.018 ± 0.001 |
1.017 ± 0.001 |
1.013 ± 0.001 |
| 0.30 |
1.034 ± 0.001 |
1.030 ± 0.001 |
1.028 ± 0.001 |
1.028 ± 0.001 |
1.024 ± 0.001 |
| 0.40 |
1.058 ± 0.001 |
1.058 ± 0.001 |
1.053 ± 0.001 |
1.049 ± 0.001 |
1.045 ± 0.001 |
| 0.50 |
1.058 ± 0.001 |
1.054 ± 0.001 |
1.051 ± 0.001 |
1.050 ± 0.001 |
1.047 ± 0.001 |
| 0.60 |
1.067 ± 0.001 |
1.061 ± 0.001 |
1.059 ± 0.001 |
1.058 ± 0.001 |
1.055 ± 0.001 |
| 0.70 |
1.076 ± 0.001 |
1.070 ± 0.001 |
1.066 ± 0.001 |
1.065 ± 0.001 |
1.064 ± 0.001 |
| 0.80 |
1.082 ± 0.001 |
1.075 ± 0.001 |
1.071 ± 0.001 |
1.070 ± 0.001 |
1.070 ± 0.001 |
| 0.90 |
1.083 ± 0.001 |
1.076 ± 0.001 |
1.071 ± 0.001 |
1.071 ± 0.001 |
1.070 ± 0.001 |
| 1.00 |
1.084 ± 0.001 |
1.083 ± 0.001 |
1.079 ± 0.001 |
1.079 ± 0.001 |
1.079 ± 0.001 |
(10)
in which
represent the density of the solute saturated solutions composed of binary solvents at temperature of T,
and
are the solute saturated solutions in the mono-solvents 1 and 2 at temperature of T. When the experimental density data reported in Table 6 was fitted to this model, the obtained M0, M1 and M2 were 20.400, 2.834 and -20.903, respectively, and the back-calculated density data were compared with the experimental data, the obtained MRD% value was 0.2%, which is quite acceptable correlation error.
Solubility data prediction of SICI
The solubility of SICI in the binary aqueous mixtures of PEG 200 at various temperatures could be predicted using a trained Jouyban-Acree model employing a minimum number of experimental data points. It has been shown that the model successfully trained by experimental solubility data of a drug in the mono-solvents at the lowest and the highest temperature of interest and in three binary mixtures at 298.2 K.30 When the solubility in PEG 200 and water at 293.2 and 313.2 K and in the solvent fractions (w1) of 0.3, 0.5 and 0.7 at 298.2 K are employed, the trained model is:
(11)
which predicts the remaining solubilities with the MRD% of 5.5% (N = 48). Equation (11) requires the solubility data in the mono-solvents at each temperature of interest which further increased the number of required experimental data points, however, one may replace the lnx1,T and lnx2,T terms with their corresponding values from the van’t Hoff equation to obtain a full predictive version of the model as:
(12)
Equation (12) predicts the remaining solubilities with the MRD% of 6.9% (N = 48). It is obvious that Eq. (12) is a full predictive model and no need for further experimental input data.
One may be interested in solubility predictions for liquid drug formulation purposes where most of the marketed dosage forms contain cosolvent fraction of less than 0.5. To provide such data, three measurements are required, i.e. the solubility data at w1 of 0.0, 0.5 and one datum at 0.5 > w1 > 0.0 for calculating the numerical value of the B coefficient of the double log-log model. When w1 = 0.3 datum at 298.2 K was used, the computed B value was equal to 0.86. Using this coefficient and employing the solubility data of w1 = 0.0 and 0.5 at each temperature, all data points could be predicted at w1 ≤ 0.5. The obtained MRD%s for 293.2, 298.2, 303.2, 308.2 and 313.2 K were 1.0, 0.7, 1.6, 6.6 and 2.1%, respectively with the overall MRD% of 2.4%. There is no significant difference between MRD% of the back-calculated and predicted solubilities at w1 ≤ 0.5 using Eq. (2) (double log-log model), i.e. 1.5% (reported in Table 3) versus 2.4%, revealing that one could successfully use this procedure to reduce the need for more experiments in drug formulation design investigations. Comparing this overall MRD% with that of Eq. (12), i.e. 2.4% against 6.9%, reveals that the MRD% for double log-log model is lower than that of the van’t Hoff-Jouyban-Acree model. However, one should keep in mind that Eq. (12) provides the capability of prediction at all possible solvent compositions and temperatures without need to further input data and only uses 7 experimental solubility data points, whereas, the double log-log model (trained version of Eq. (2)) provides the solubility prediction at w1 ≤ 0.5 and needs two more experimental data for prediction at any temperature of interest.
Comparison of solubilization power of the cosolvents to enhance aqueous solubility of SICI
As noticed above, in the pharmaceutical industry, the permissible cosolvents should be used in the as much as possible lower concentrations due to their toxicity and interactions with the main drug both in formulation and in the patient’s body. In the liquid formulations, the cosolvent may change the stability of drug which is an important parameter concerning the shelf life of the formulation. Some cosolvent’s, such as ethanol which possesses central nervous system (CNS) depressant effect, may interact with the pharmacological action of CNS drugs. Prof. Yalkowsky, a pioneer of solubilization methods and solubility data modeling in the pharmaceutical area, proposed the solubilization power (Ϭ) to compare the power of a cosolvent for solubilization of a poorly water soluble drug in cosolvent + water mixtures, and is defined as31:
We have modified the equation as32:
for better representation of the solubilization for solubility profiles showing the solubility maxima.32 In Eq. (14), xm,Max is the maximum solubility of the solute in the binary solvent system and w1,Max is the PEG 200 mass fraction which provided the largest SICI solubility. It is obvious that Ϭ = ω when the maximum solubility of a solute is obtained in the neat cosolvent (for solubility systems without solubility maxima). The computed Ϭ and ω values for the solubility of SICI in cosolvent + water mixtures taken from the literature23,33-37 were listed in Table 7. The best cosolvent among studied ones for solubilizing SICI is 1-propanol (with ω = 2.19) and the worst one is EG (ω = 0.67). The negative Ϭ values for 1-propanol and 2-propanol mean that the solubility of SICI in neat cosolvent is lower than aqueous solubility (x1 < x2).
Table 7.
Solubilization powers of SICI for the studied cosolvents
|
Cosolvent
|
σ
|
ω
|
Reference for solubility data
|
| PEG 200 |
1.14 |
1.14 |
This work |
| PEG 400 |
1.30 |
1.54 |
23
|
| PG |
0.56 |
1.04 |
34
|
| EGa |
0.67 |
0.67 |
37
|
| EtOH |
-0.13 |
1.52 |
35
|
| 1-Propanol |
-0.29 |
2.19 |
33
|
| 2-Propanol |
-0.28 |
1.41 |
36
|
a EG is a toxic cosolvent and could not be used in pharmaceutical formulations.
Density data prediction of SICI
The density of SICI’s saturated solutions in the binary aqueous mixtures with PEG 200 could be predicted by employing the experimental density values of the saturated solutions in the mono-solvents without measuring the density values in the mixed solvent systems. The previously trained model employing the solute free density data of PEG 200 + water mixtures at various temperatures is38:
(15)
The effect of the dissolved low soluble drugs on the density of the saturated solution composed of binary solvents is negligible and one may use the M terms of the solute free solvent mixture for predicting the density of solute saturated solutions by using the measured density data in the mono-solvents as:
(16)
which predicts the density of SICI saturated solutions with the MRD% of 0.3 which is quite acceptable prediction error. Using Eq. (14), there is no need to measure the density in the SICI saturated solutions in mixed solvents, and the densities of SICI saturated solutions in the neat mono-solvents are required.
Calculation of thermodynamic parameters of SICI dissolution
The thermodynamic parameters and the corresponding Gibbs free energy contributions for SICI dissolution are recorded in Table 8 and Figure 4. The positive ΔS° values across both mono-solvents and mixed solvent systems imply an increase in disorder upon dissolution. Furthermore, the positive ΔH° values confirm the endothermic nature of the dissolution, suggesting that the solvation process requires more energy due to stronger intermolecular forces within the solvent than between the solvent and SICI. This energy discrepancy suggests that the formation of new solute-solvent bonds does not release enough energy to offset the energy used to disrupt the existing solvent-solvent interactions. In the context of the dissolution kinetics of SICI, the positive values of Gibbs free energy change (ΔG°) and enthalpy change (ΔH°) indicate non-spontaneity in the mixing process. The range of ΔG° spans from 14.99 and 21.46 kJ•mol−1 attaining minimum and maximum at mass fraction endpoints w1 = 1.0 and 0.0, respectively. The dissolution profile, as delineated in Figure 4, exhibits a non-linear correlation with distinct negative slopes within the mass fraction intervals 0.1 ≤ w1 ≤ 0.3, and 0.7 ≤ w1 ≤ 0.9 conversely displaying positive slopes in the intervals 0.0 ≤ w1 ≤ 0.1, 0.3 ≤ w1 ≤ 0.7, and 0.9 ≤ w1 ≤ 1.0. The dissolution mechanism transitions from entropy-driven at intermediary mass fractions to enthalpy-driven at the extremities of the compositional spectrum.
Table 8.
Apparent thermodynamic parameters for dissolution behavior of sildenafil citrate in the binary mixtures of PEG 200 and water at Thm
|
w1a
|
ΔG°
(kJ.mol–1)
|
ΔH°
(kJ.mol–1)
|
ΔS°
(J.K–1.mol–1)
|
TΔS°
(kJ.mol–1)
|
ζH
|
ζTS
|
| 0.00 |
21.46 |
32.59 |
36.73 |
11.13 |
0.745 |
0.255 |
| 0.10 |
21.12 |
31.96 |
35.76 |
10.84 |
0.747 |
0.253 |
| 0.20 |
20.76 |
33.43 |
41.82 |
12.67 |
0.725 |
0.275 |
| 0.30 |
20.34 |
34.38 |
46.35 |
14.04 |
0.710 |
0.290 |
| 0.40 |
19.83 |
32.59 |
42.11 |
12.76 |
0.719 |
0.281 |
| 0.50 |
19.22 |
31.63 |
40.95 |
12.41 |
0.718 |
0.282 |
| 0.60 |
18.52 |
30.49 |
39.52 |
11.97 |
0.718 |
0.282 |
| 0.70 |
17.73 |
30.58 |
42.40 |
12.85 |
0.704 |
0.296 |
| 0.80 |
17.09 |
32.73 |
51.59 |
15.63 |
0.677 |
0.323 |
| 0.90 |
16.34 |
32.83 |
54.42 |
16.49 |
0.666 |
0.334 |
| 1.00 |
14.99 |
25.34 |
34.16 |
10.35 |
0.710 |
0.290 |
a w1 is mass fraction of PEG 200 in the PEG 200 and water mixtures in the absence of sildenafil citrate.
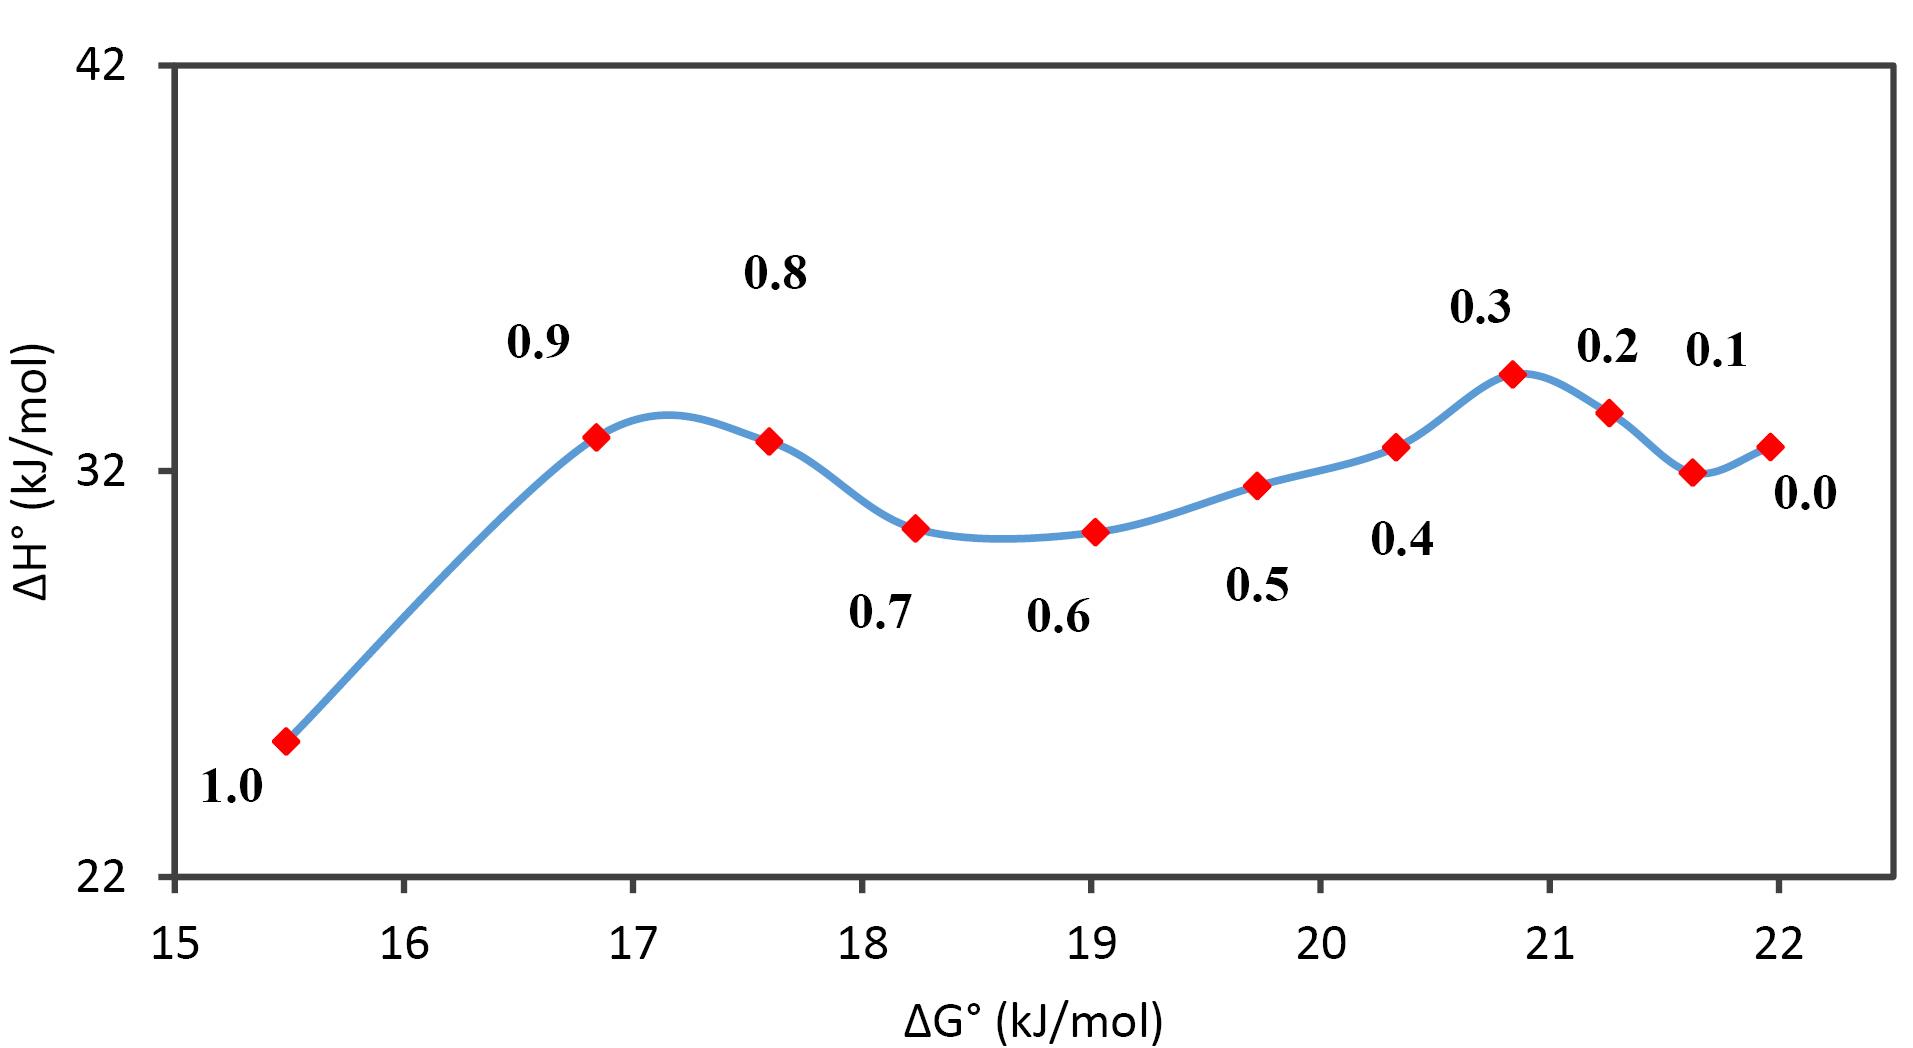
Figure 4.
Enthalpy-entropy compensation plot for sildenafil citrate in the mixtures of PEG 200 and water at 303.0 K. The points represent the mass fraction of PEG 200 in PEG 200 and water mixtures in the absence of sildenafil citrate
.
Enthalpy-entropy compensation plot for sildenafil citrate in the mixtures of PEG 200 and water at 303.0 K. The points represent the mass fraction of PEG 200 in PEG 200 and water mixtures in the absence of sildenafil citrate
Conclusion
The mole fraction solubility of SICI exhibits a direct relationship with both the mass fraction of PEG 200 and the temperature. Specifically, the solubility apex for SICI was observed in PEG 200 across all binary solvent compositions. The thermodynamic parameters, characterized by positive ΔG° and ΔH° values, underscore the non-spontaneous and endothermic nature of the dissolution process. Further scrutiny reveals an entropic impetus governing the solvation of SICI. The empirical and theoretical solubility data presented herein hold significant implications for the refinement of SICI drug formulation, contributing to theoretical studies and crystallization processes.
Competing Interests
None declared.
Ethical Approval
The project details were approved by the Ethics Committee of Tabriz University of Medical Sciences with the approval code of IR.TBZMED.VCR.REC.1400.505.
Supplementary Files
Supplementary file 1 contains Tables S1-S3 and Figures S1-S3.
(pdf)
References
- Fiscus RR. Involvement of cyclic GMP and protein kinase G in the regulation of apoptosis and survival in neural cells. Neurosignals 2002; 11(4):175-90. doi: 10.1159/000065431 [Crossref] [ Google Scholar]
- Sanders O. Sildenafil for the treatment of Alzheimer’s disease: a systematic review. J Alzheimers Dis Rep 2020; 4(1):91-106. doi: 10.3233/adr-200166 [Crossref] [ Google Scholar]
- Di L, Fish PV, Mano T. Bridging solubility between drug discovery and development. Drug Discov Today 2012; 17(9-10):486-95. doi: 10.1016/j.drudis.2011.11.007 [Crossref] [ Google Scholar]
- Jouyban A, Soltanpour S, Soltani S, Tamizi E, Abolghassemi Fakhree MA, Acree WE Jr. Prediction of drug solubility in mixed solvents using computed Abraham parameters. J Mol Liq 2009; 146(3):82-8. doi: 10.1016/j.molliq.2009.02.003 [Crossref] [ Google Scholar]
- Martínez F, Jouyban A, Acree WE Jr. Pharmaceuticals solubility is still nowadays widely studied everywhere. Pharm Sci 2017; 23(1):1-2. doi: 10.15171/PS.2017.01 [Crossref] [ Google Scholar]
- Khan AD, Singh L. Various techniques of bioavailability enhancement: a review. J Drug Deliv Ther 2016; 6(3):34-41. [ Google Scholar]
- Keramatnia F, Shayanfar A, Jouyban A. Thermodynamic solubility profile of carbamazepine-cinnamic acid cocrystal at different pH. J Pharm Sci 2015; 104(8):2559-65. doi: 10.1002/jps.24525 [Crossref] [ Google Scholar]
- Rubino JT. Cosolvents and cosolvency. In: Swarbrick J, Zhong HA. Encyclopedia of Pharmaceutical Science and Technology, Six Volume Set. CRC Press. 2013. p. 711-22.
- Yalkowsky SH. Solubility and Solubilization in Aqueous Media. American Chemical Society; 1999.
- Jung SY, Seo YG, Kim GK, Woo JS, Yong CS, Choi HG. Comparison of the solubility and pharmacokinetics of sildenafil salts. Arch Pharm Res 2011; 34(3):451-4. doi: 10.1007/s12272-011-0313-y [Crossref] [ Google Scholar]
- Baluja S, Bhesaniya K. Thermodynamic parameters of solutions of sildenafil citrate in some organic solvents at different temperatures. J Fundam Appl Sci 2014; 6(1):106-15. doi: 10.4314/jfas.v6i1.9 [Crossref] [ Google Scholar]
- Honarvar B, Sajadian SA, Rojas A, Galotto MJ, Jouyban A. Solubility and thermodynamic modeling of sildenafil citrate in supercritical carbon dioxide. Fluid Phase Equilib 2023; 566:113677. doi: 10.1016/j.fluid.2022.113677 [Crossref] [ Google Scholar]
- Soltanmohammadi F, Jouyban A, Shayanfar A. New aspects of deep eutectic solvents: extraction, pharmaceutical applications, as catalyst and gas capture. Chem Zvesti 2021; 75(2):439-53. doi: 10.1007/s11696-020-01316-w [Crossref] [ Google Scholar]
- Nemati A, Moradi M, Rahimpour E, Jouyban A. Measurement and modeling of sildenafil citrate solubility in the mixtures of choline chloride/propylene glycol and water at various temperatures. Azerbaijan Pharm Pharmacother J 2022; 22(2):5-14. doi: 10.58495/yrxg3956 [Crossref] [ Google Scholar]
- Rezaei H, Rahimpour E, Ghafourian T, Martínez F, Barzegar-Jalali M, Jouyban A. Solubility of caffeine in N-methyl-2-pyrrolidone + ethanol mixture at different temperatures. J Mol Liq 2020; 300:112354. doi: 10.1016/j.molliq.2019.112354 [Crossref] [ Google Scholar]
- Rezaei H, Rahimpour E, Martínez F, Zhao H, Jouyban A. Solubility of sildenafil citrate in 1-propanol + water mixtures at different temperatures. J Mol Liq 2021; 338:116631. doi: 10.1016/j.molliq.2021.116631 [Crossref] [ Google Scholar]
- Zarghampour A, Jouyban K, Jouyban-Gharamaleki V, Jouyban A, Rahimpour E. A description on the shake-flask and laser monitoring-based techniques for determination of the drug’s solubility. Pharm Sci 2024; 30(2):274-8. doi: 10.34172/ps.2024.2 [Crossref] [ Google Scholar]
- Barzegar-Jalali M, Hanaee J. Model for solubility estimation in mixed solvent systems. Int J Pharm 1994; 109(3):291-5. doi: 10.1016/0378-5173(94)90391-3 [Crossref] [ Google Scholar]
- Jouyban A, Acree WE Jr. Mathematical derivation of the Jouyban-Acree model to represent solute solubility data in mixed solvents at various temperatures. J Mol Liq 2018; 256:541-7. doi: 10.1016/j.molliq.2018.01.171 [Crossref] [ Google Scholar]
- Jouyban-Gharamaleki A. The modified Wilson model and predicting drug solubility in water-cosolvent mixtures. Chem Pharm Bull 1998; 46(6):1058-61. doi: 10.1248/cpb.46.1058 [Crossref] [ Google Scholar]
- Vahdati S, Shayanfar A, Hanaee J, Martínez F, Acree WE Jr, Jouyban A. Solubility of carvedilol in ethanol + propylene glycol mixtures at various temperatures. Ind Eng Chem Res 2013; 52(47):16630-6. doi: 10.1021/ie403054z [Crossref] [ Google Scholar]
- Perlovich GL, Kurkov SV, Bauer-Brandl A. Thermodynamics of solutions II Flurbiprofen and diflunisal as models for studying solvation of drug substances. Eur J Pharm Sci 2003; 19(5):423-32. doi: 10.1016/s0928-0987(03)00145-3 [Crossref] [ Google Scholar]
- Pirhayati FH, Shayanfar A, Rahimpour E, Barzegar-Jalali M, Martínez F, Jouyban A. Solubility of sildenafil citrate in polyethylene glycol 400 + water mixtures at various temperatures. J Mol Liq 2017; 240:268-72. doi: 10.1016/j.molliq.2017.05.057 [Crossref] [ Google Scholar]
- Nasri AH, Jafari P, Hemmati S, Barzegar-Jalali M, Rahimpour E, Jouyban A. Impact of polyethylene glycol molar mass and structural isomer of alcohol on the solubility and dissolution enhancement of mesalazine. Fluid Phase Equilib 2024; 578:114007. doi: 10.1016/j.fluid.2023.114007 [Crossref] [ Google Scholar]
- Jafari P, Rahimpour E, Jouyban A. Solubility of bosentan in polyethylene glycol 400 + water mixtures: experimental and mathematical computations. Pharm Sci 2022; 29(2):228-35. doi: 10.34172/ps.2022.13 [Crossref] [ Google Scholar]
- Rathi PB, Kale M, Soleymani J, Jouyban A. Solubility of etoricoxib in aqueous solutions of glycerin, methanol, polyethylene glycols 200, 400, 600, and propylene glycol at 2982 K. J Chem Eng Data 2018; 63(2):321-30. doi: 10.1021/acs.jced.7b00709 [Crossref] [ Google Scholar]
- Khezri S, Jafari P, Rahimpour E, Jouyban A. Enhancing the equilibrium solubility of salicylic acid in aqueous media by using polyethylene glycols 200, 400 and 600 as cosolvents: Correlation and dissolution thermodynamics. J Chem Thermodyn 2023; 186:107135. doi: 10.1016/j.jct.2023.107135 [Crossref] [ Google Scholar]
- Rahimpour E, Moradi M, Sheikhi-Sovari A, Rezaei H, Rezaei H, Jouyban-Gharamaleki V. Comparative drug solubility studies using shake-flask versus a laser-based robotic method. AAPS PharmSciTech 2023; 24(7):207. doi: 10.1208/s12249-023-02667-9 [Crossref] [ Google Scholar]
- Jouyban A, Acree WE Jr. A single model to represent physico-chemical properties of liquid mixtures at various temperatures. J Mol Liq 2021; 323:115054. doi: 10.1016/j.molliq.2020.115054 [Crossref] [ Google Scholar]
- Dadmand S, Kamari F, Acree WE Jr, Jouyban A. Solubility prediction of drugs in binary solvent mixtures at various temperatures using a minimum number of experimental data points. AAPS PharmSciTech 2018; 20(1):10. doi: 10.1208/s12249-018-1244-4 [Crossref] [ Google Scholar]
- Li A, Yalkowsky SH. Predicting cosolvency 1 Solubility ratio and solute log kow. Ind Eng Chem Res 1998; 37(11):4470-5. doi: 10.1021/ie980232v [Crossref] [ Google Scholar]
- Jouyban A, Abolghassemi Fakhree MA. A new definition of solubilization power of a cosolvent. Pharmazie 2008; 63(4):317-9. doi: 10.1691/ph.2008.7288 [Crossref] [ Google Scholar]
- Rezaei H, Rahimpour E, Martínez F, Zhao H, Jouyban A. Solubility of sildenafil citrate in 1-propanol + water mixtures at different temperatures. J Mol Liq 2021; 338:116631. doi: 10.1016/j.molliq.2021.116631 [Crossref] [ Google Scholar]
- Pirhayati FH, Shayanfar A, Rahimpour E, Barzegar-Jalali M, Martínez F, Jouyban A. Solubility of sildenafil citrate in propylene glycol + water mixtures at various temperatures. Phys Chem Liq 2018; 56(4):508-17. doi: 10.1080/00319104.2017.1354376 [Crossref] [ Google Scholar]
- Pirhayati FH, Shayanfar A, Fathi-Azarbayjani A, Martínez F, Sajedi-Amin S, Jouyban A. Thermodynamic solubility and density of sildenafil citrate in ethanol and water mixtures: measurement and correlation at various temperatures. J Mol Liq 2017; 225:631-5. doi: 10.1016/j.molliq.2016.11.055 [Crossref] [ Google Scholar]
- Vakili K, Rezaei H, Poturcu K, Jouyban A, Hanaee J, Martínez F. Solubility study of sildenafil citrate in (2-propanol + water) binary mixtures at different temperatures. J Mol Liq 2021; 344:117915. doi: 10.1016/j.molliq.2021.117915 [Crossref] [ Google Scholar]
- Hatefi A, Rahimpour E, Ghafourian T, Martínez F, Barzegar-Jalali M, Jouyban A. Solubility of sildenafil citrate in the binary mixtures of ethylene glycol and water at different temperatures. J Mol Liq 2020; 299:112127. doi: 10.1016/j.molliq.2019.112127 [Crossref] [ Google Scholar]
- Panahi-Azar V, Ahmadian S, Martínez F, Acree WE Jr, Jouyban A. Thermodynamic studies of fluphenazine decanoate solubility in PEG 200 + water mixtures. Fluid Phase Equilib 2012; 330:36-43. doi: 10.1016/j.fluid.2012.06.005 [Crossref] [ Google Scholar]